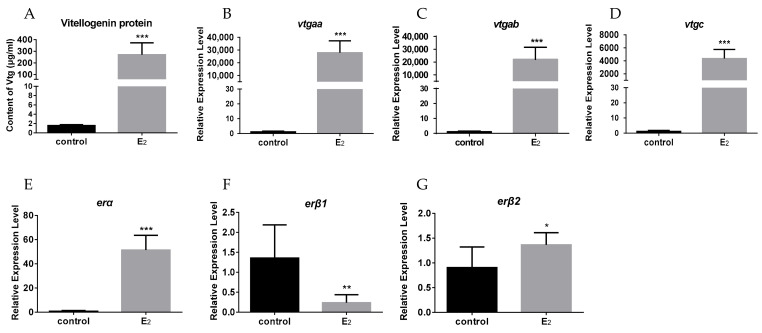
Figure 2.
The content of VTG protein and mRNA expression of vtgs and ers in the livers of juvenile female groupers in injection group (n = 8) (5mg/kg E2) and control group (n = 8): (A) VTG protein levels in the liver; (B–G) the mRNA levels of vtgaa, vtgab, vtgc, erα, erβ1, and erβ2 in the liver. Data are expressed as the mean ± SEM (n = 8) and analyzed by unpaired Student’s t-test. Asterisks (*) indicate statistical differences (* p < 0.05, ** p < 0.01, *** p < 0.001).

