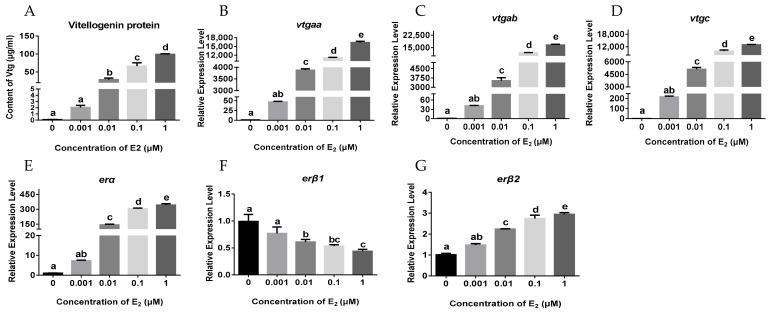
Figure 3.
Effects of E2 treatment on the expression of vtgs and ers in primary hepatocytes: (A) VTG protein levels in the hepatocytes; (B–G) the mRNA levels of vtgaa, vtgab, vtgc, erα, erβ1 and erβ2 in the hepatocytes. The cells were treated with different dose of E2 for 24 h. Data are expressed as the mean ± SEM (n = 4) and analyzed by one-way ANOVA followed by Tukey’s post-hoc test. Different letters above the error bars indicate statistical differences at p < 0.05.

