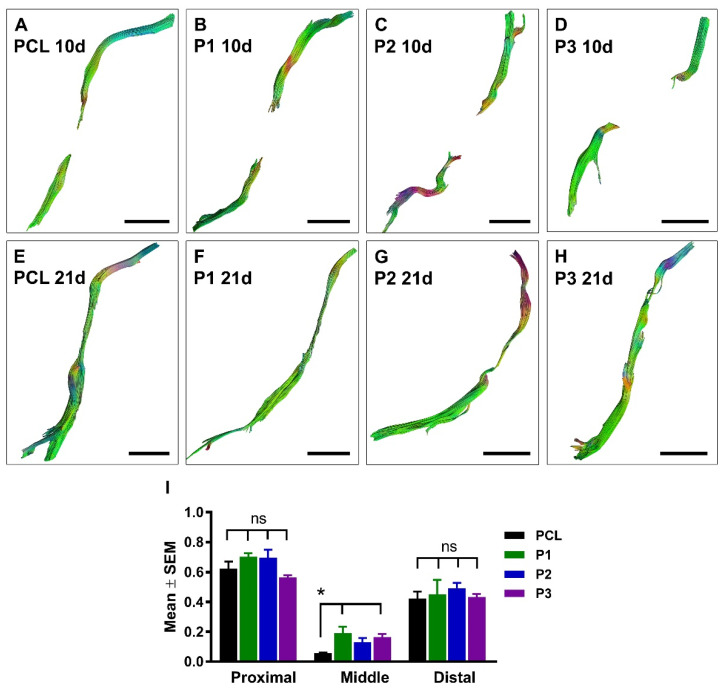
Figure 6.
Diffusion tensor imaging of regenerating axons in the conduits. Representative axial DTI images at 10 days (A–D) and 21 days (E–H) after sciatic nerve injury and repair with empty PCL conduit or PCL conduit filled with P1, P2, or P3 hydrogel. Histogram in (I) shows quantification of the fractional anisotropy measured in proximal, middle, and distal ROIs at 21 days after nerve injury and repair (PCL, n = 5, P1, n = 5, P2, n = 7, and P3, n = 7). p < 0.05 is indicated by * (PCL versus P1 and P3 hydrogels); ns, not significantly different. Scale bar, 5 mm.

