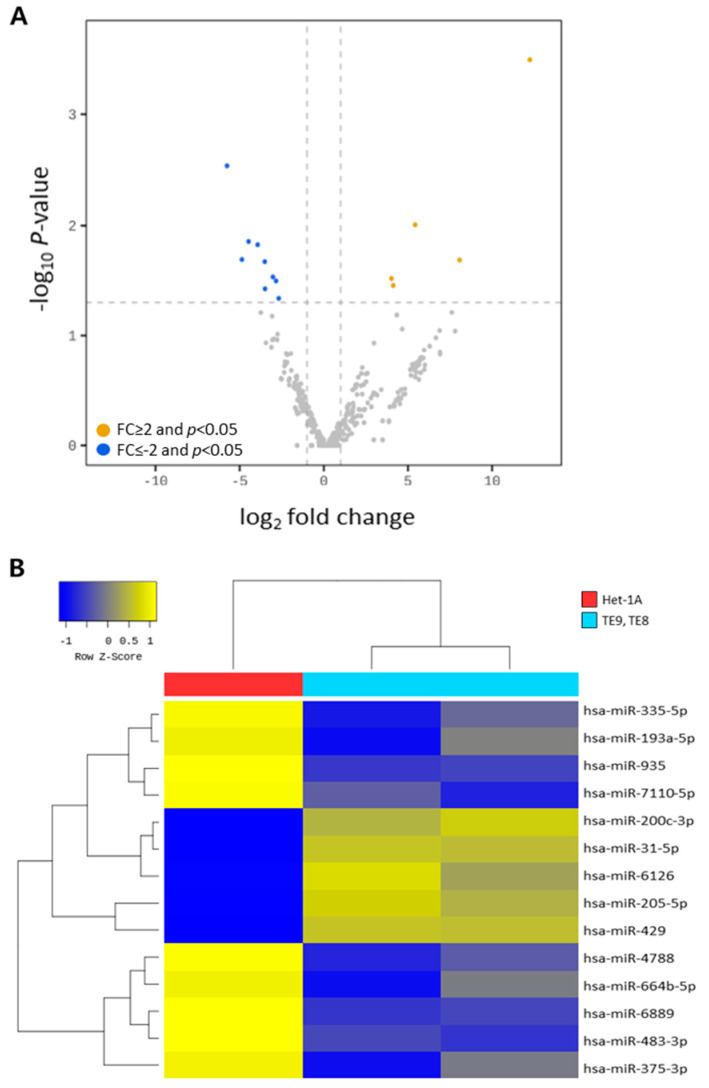
Figure 4.
Differentially expressed exosomal miRNAs between esophageal epithelial cell and esophageal squamous cell carcinoma cell lines. (A) Volcano plots of differentially expressed exosomal miRNAs. Colored circles represent miRNAs significant at |fold change (FC)| ≥ 2 and p < 0.05. Orange dot, up-regulated; blue dot, down-regulated. (B) Heatmap of hierarchical clustering based on 14 differentially expressed exosomal miRNAs (five up-regulated and nine down-regulated). Samples with similar miRNA expression were grouped.

