Figure 5.
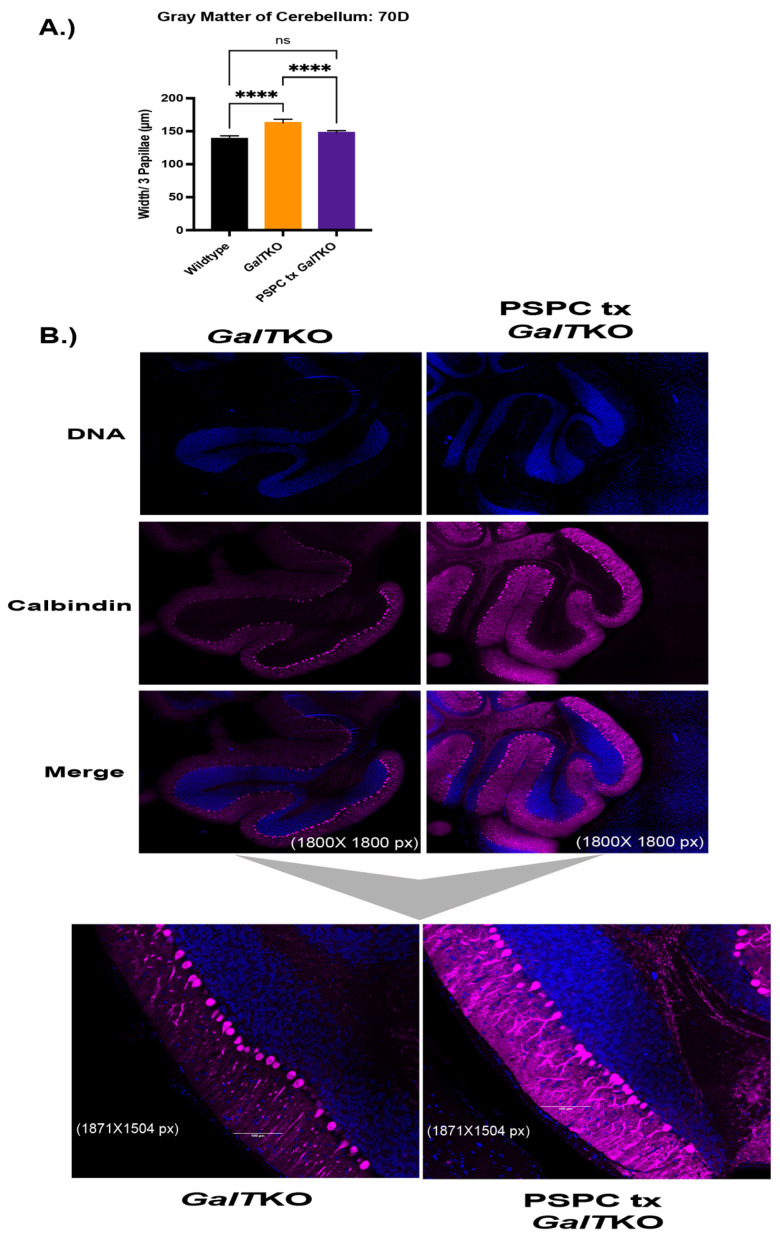
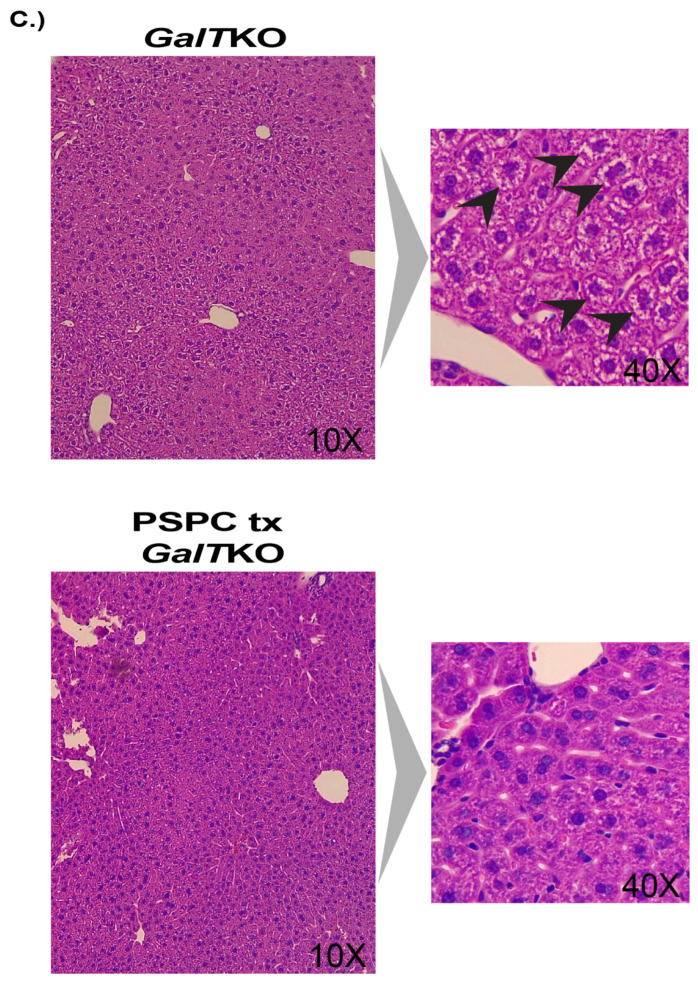
Gray matter widths, dendritic arborization, and liver histology after PSPC supplementation. (A) Shows gray matter thickness of treated mice compared to wildtype and untreated GalTKO mice. In (B), the first six panels are show at 1800 × 1800 pixel magnification with bottom subfigures at 1871 × 1504 pixel magnification. (C) Panels on the left show H&E-stained liver histology at 10× and 40× in the subfigure (C). Black arrows depict balloon-cell change areas in hepatocyte cytoplasm. **** p ≤ 0.0001.


