Figure 3.
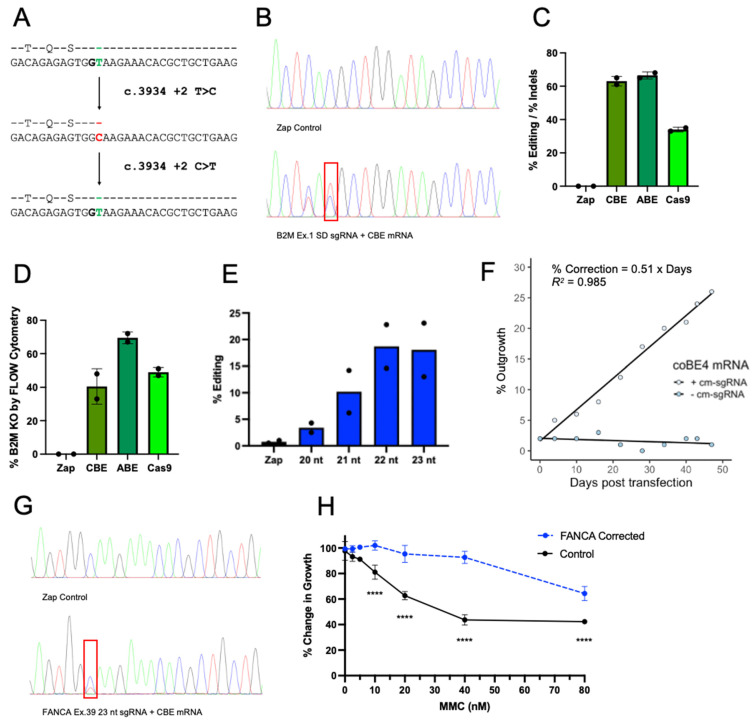
Cytosine base editing in FANCA c.3934 + 2T > C patient-derived fibroblasts and LCL. (A) Editing scheme; immediately following FANCA exon 39, a SD (GT) is disrupted by a + 2T > C mutation (CG). CBE directly converts C > T back to the WT sequence. (B) B2M Ex.1 SD sgRNA region chromatograms of Sanger sequencing after PCR amplification of B2M exon 1 using (http://baseeditr.com/, accessed on 1 January 2018–1 July 2022) [35]. (C) Percentage of B2M editing events (Kluesner and Nedveck et al. 2018) or indels (https://ice.synthego.com/#/, accessed on 1 January 2018–1 July 2022) identified by Sanger sequencing 5 days post electroporation. Data are represented as mean ± SD with n = 2 replicates. (D) Percentage of B2M protein KO as shown by flow cytometry 6 days post electroporation. (E) Percentage of FANCA editing events identified by Sanger sequencing after in vitro incubation of FANCA Ex. 39 amplicons, reverse FANCA Ex. 39 primers, and respective sgRNAs. Data are represented as mean ± SD with n = 2 replicates. (F) Correlation of editing (C > T) as identified by Sanger sequencing of FA fibroblasts corrected using CBE mRNA with FANCA c.3934 + 2T > C 22 nt sgRNA over time. Cell pellets were collected and analyzed on respective days up to 47 days in fibroblast media. (G) FANCA sgRNA region chromatograms of Sanger sequencing after PCR amplification of FANCA exon 39 using EditR. (H) MMC hypersensitivity in unedited (control) and edited FA fibroblasts (CBE mRNA + FANCA c.3934 + 2T > C 22 nt sgRNA) after 9 days in culture. Data are represented as mean ± SD with n = 3 replicates. Two-way ANOVA followed by Sidak’s multiple comparison test (**** p < 0.0001).

