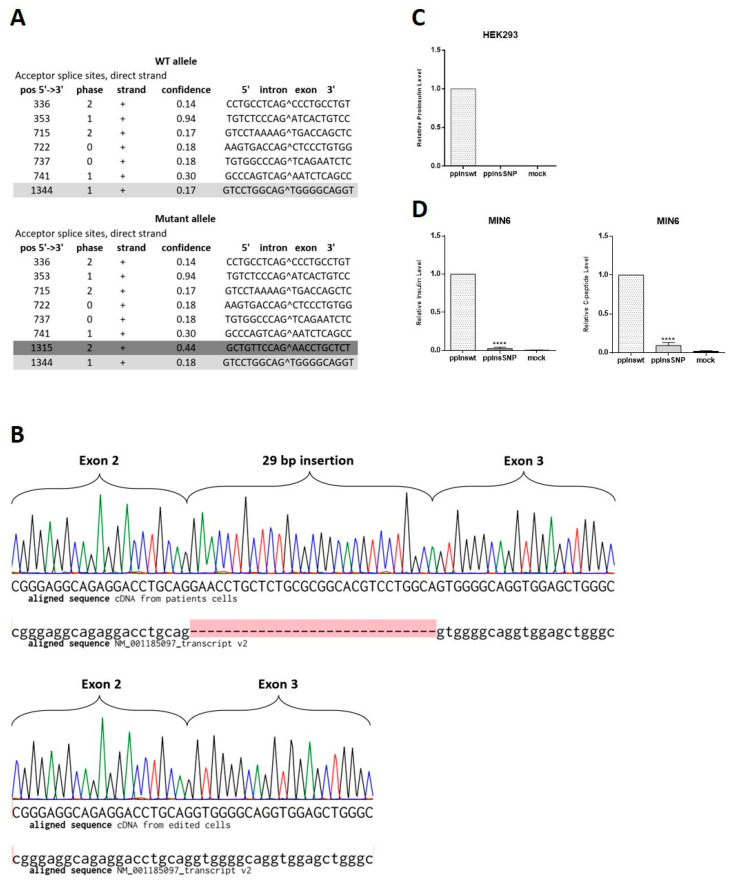
Figure 4.
The c.188-31G>A INS splice variant detection and analysis of its influence on insulin expression. (A) Splice variant prediction. Dark grey color shows normal splice site between exon 2 and 3 with the confidence 0.17. Bright grey color marks the new ectopic splice site with the higher confidence (0.44) in comparison with the normal site (0.18). (B) Sequencing chromatograms of the region of INS cDNA obtained from mRNA of iPSC-derived beta-like cells aligned to H. sapiens insulin, transcript variant 2, mRNA (NM_001185097.2). Upper panel shows mutant allele in cDNA library from patient’s cells, where the red highlight indicates 29 bp insertion that is absent in NM_001185097.2, lower panel shows wild type allele in cDNA library from CRISPR/Cas9-edited cells. (C) HEK293 cells were transiently transfected with pcDNA3.1-preproIns wild type or SNP. The data are normalized to activity of beta-galactosidase. Intracellular level of proinsulin is shown as means ± SD (n = 3). (D) MIN6 insulinoma cells were transiently transfected with pcDNA3.1-preproIns wild type or SNP. Intracellular levels of synthesized insulin (left) and C-peptide (right) are shown as means ± SD (n = 3); **** p < 0.0001.

