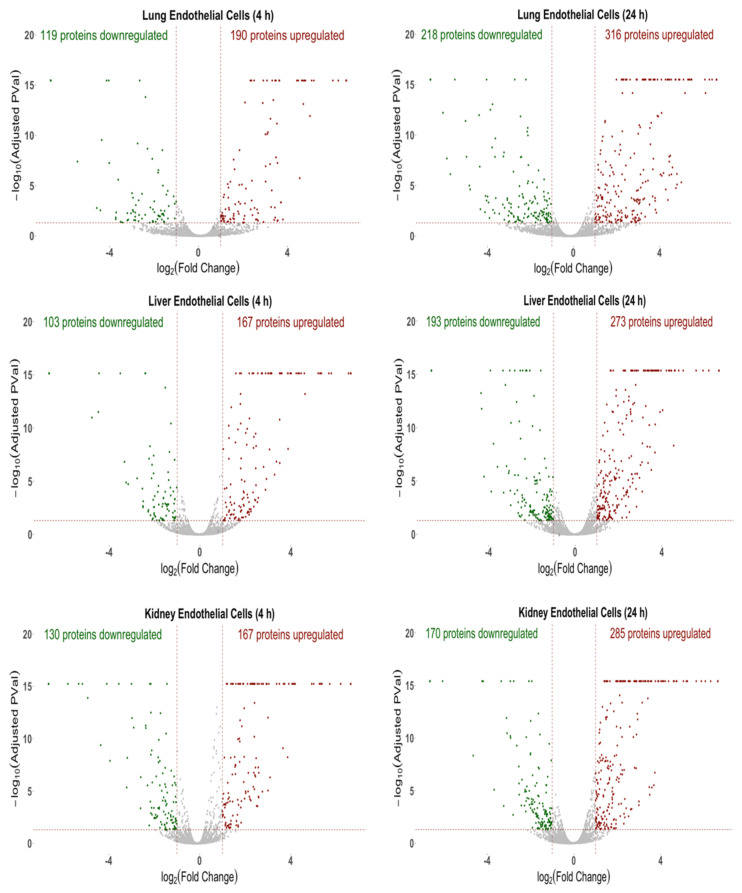
Figure 1.
Volcano plots of the protein changes for the 4 h and 24 h cytomix-treated ECs as compared to control. For all three organs, the red represents upregulated proteins, green represents downregulated proteins and gray represents proteins that were not significantly altered in response to cytomix treatment.

