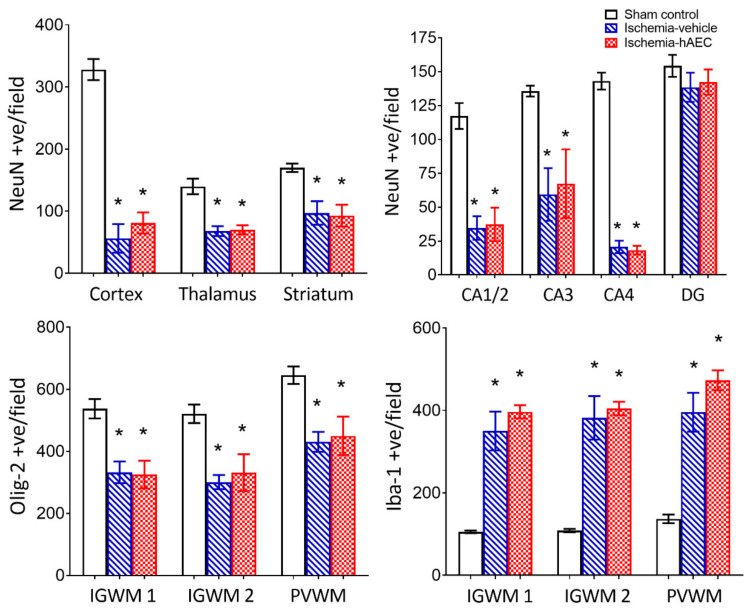
Figure 3.
Neuronal number in the cortex, thalamus and striatum (top left) and CA1/2, CA3, CA4 and dentate gyrus of the hippocampus (top right), Olig2-positive total oligodendrocyte number (bottom left) and Iba1-positive microglial number (bottom right) in the sham control (n = 8), ischemia-vehicle (n = 7) and ischemia-hAEC groups (n = 6). Data are mean ± SEM * p < 0.05 vs. sham control.

