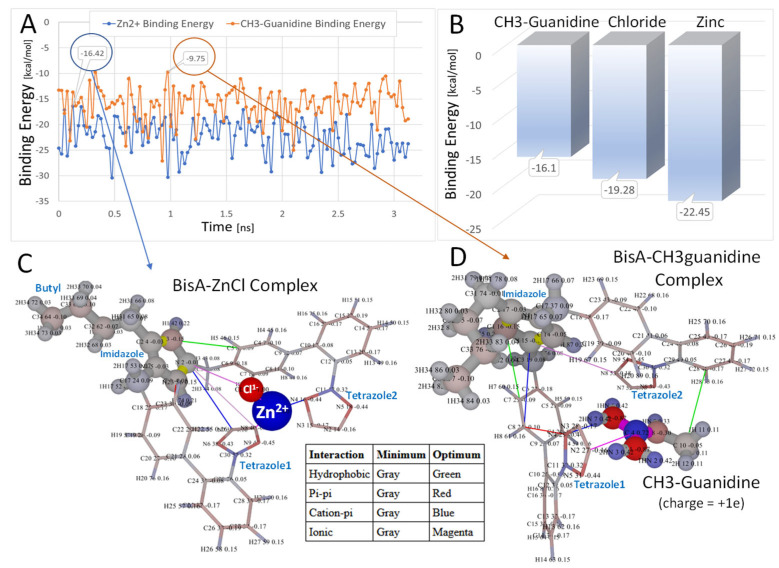
Figure 4.
In vacuo molecular dynamics relaxation (A,B) of Bis-A [−1e] in the presence of ZnCl [+1e] (C) or CH3-guanidine [+1e] (D). The MD simulations were run for 3.5 ns in vacuo at 298 K using AMBER-14 parameters. (A): binding energies as a function of time [ns] for CH3-guanidine (orange) and ZnCl (blue). (B): binding energies of ligands in kcal/mol averaged over the MD trajectories. (C,D): the most relaxed conformations are shown (over the MD simulations) for the BisA-zinc (−16.42 kcal/mol) and BisA-CH3-guanidine (−9.75 kcal/mol) complexes. In both cases, the ligand was trapped between the anionic tetrazole rings. In the case of the BisA-ZnCl simulation, the chloride ion was oriented toward the net positive imidazole group, while the zinc ion was oriented toward the tetrazole groups. Intermolecular interactions using a 6.0-Å cutoff are indicated as colored lines in (C,D) (refer to embedded table). Atomic charges are color-coded as follows: red = more negative; blue = more positive. Note that higher (less negative) energies correspond to stronger binding. Thus, the order of BisA-ligand binding (from strong to weak) was CH3-guanidine to Chloride ion to Zinc ion.

