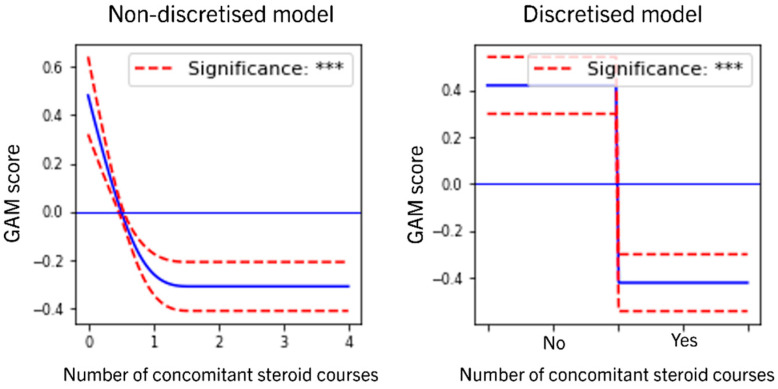
Figure 4.
Visual summary of the effect of the number of concomitant steroid courses in the longitudinal remission model, non-discretized model (left) and discretized model (right). Horizontal blue line denotates 0 (no effect), solid blue line represents the estimated effect of different values of the covariates and discontinuous red lines represent 95% confidence intervals. *** p < 0.001.

