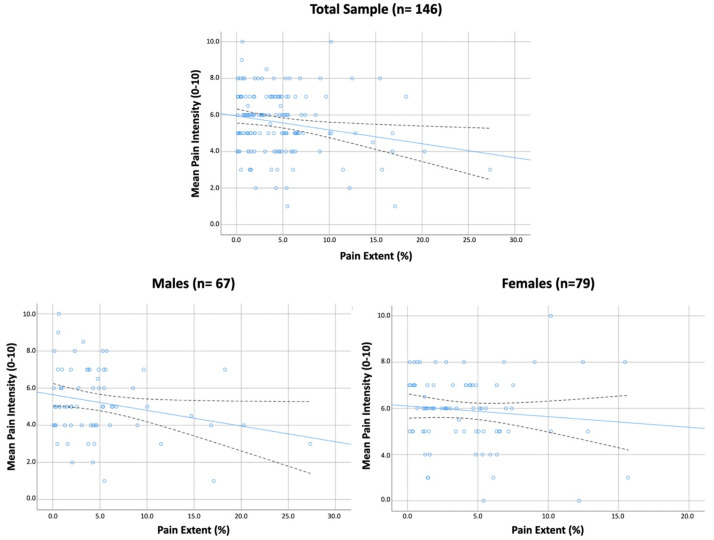
Figure 2.
Scatter plots of correlations between pain extent and the intensity of pain symptoms in previously hospitalized COVID-19 survivors with post-COVID pain. Total sample (n = 146), males (n = 67); females (n = 79). Note that several points are overlapping. Blue lines represent adjusted lines and black lines represent 95% Confidence Intervals.

