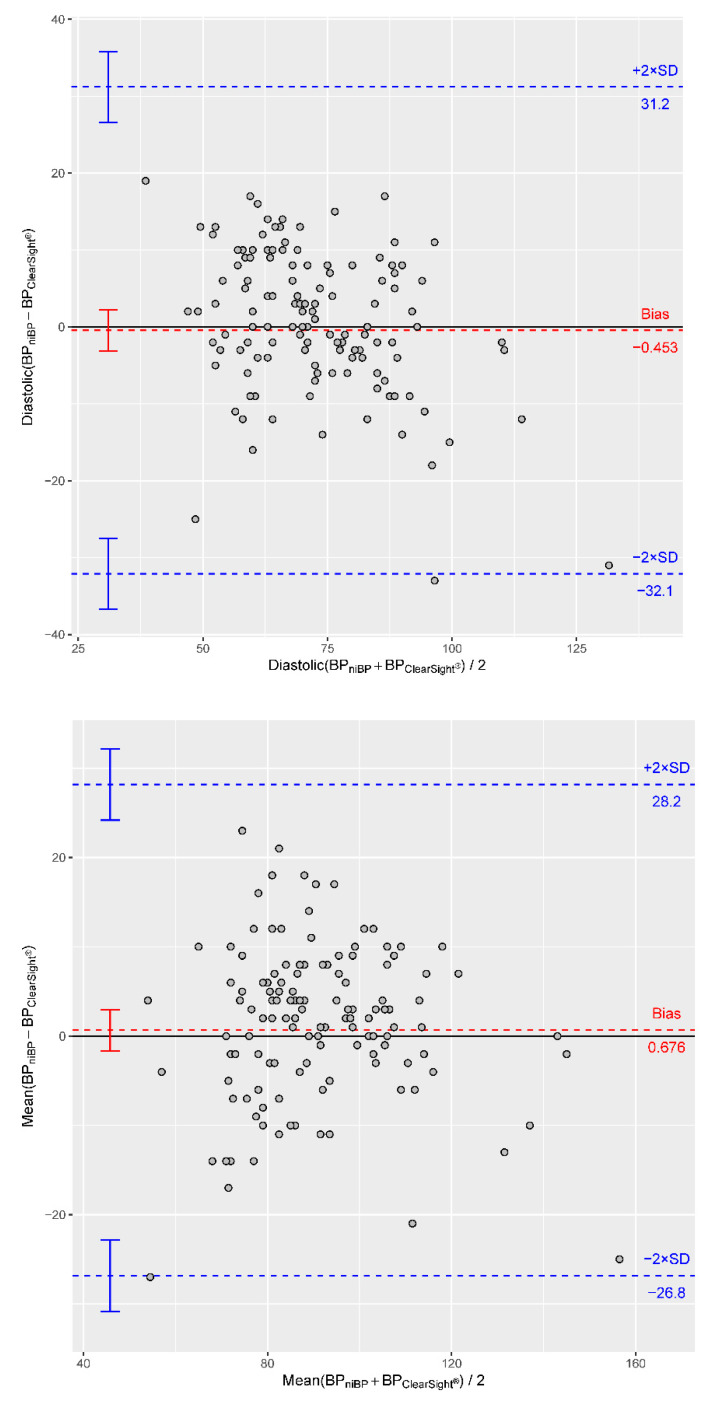
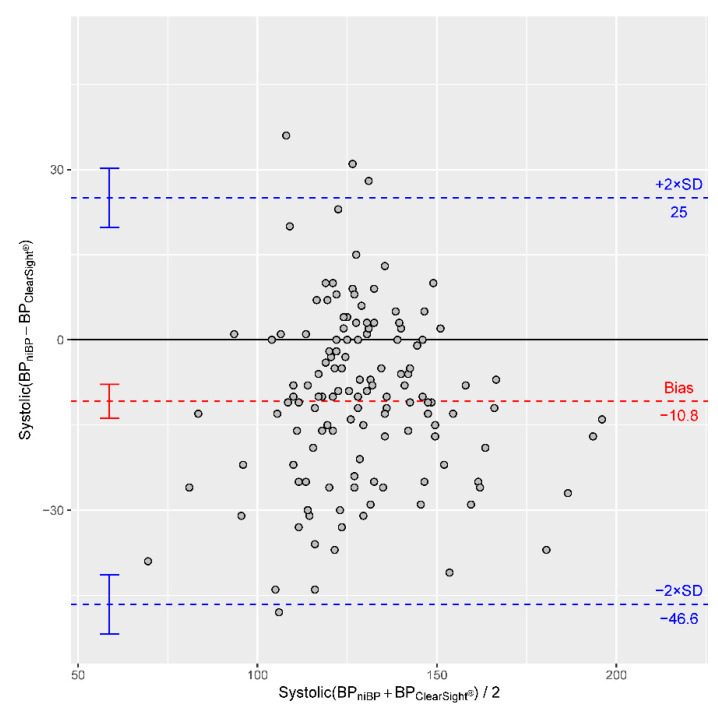
Figure 3.
Bland-Altman plots show a bias of −10.8 for systolic, a bias of −0.45 for diastolic and a bias of 0.68 for mean blood pressure measurements between the two benchmarked methods (horizontal dashed lines in red). Additionally, the 2× standard deviation (SD) is provided (horizontal dashed lines in blue). BPniBP = non-invasive blood pressure. BPclearsight = blood pressure measured by Clearsight®.


