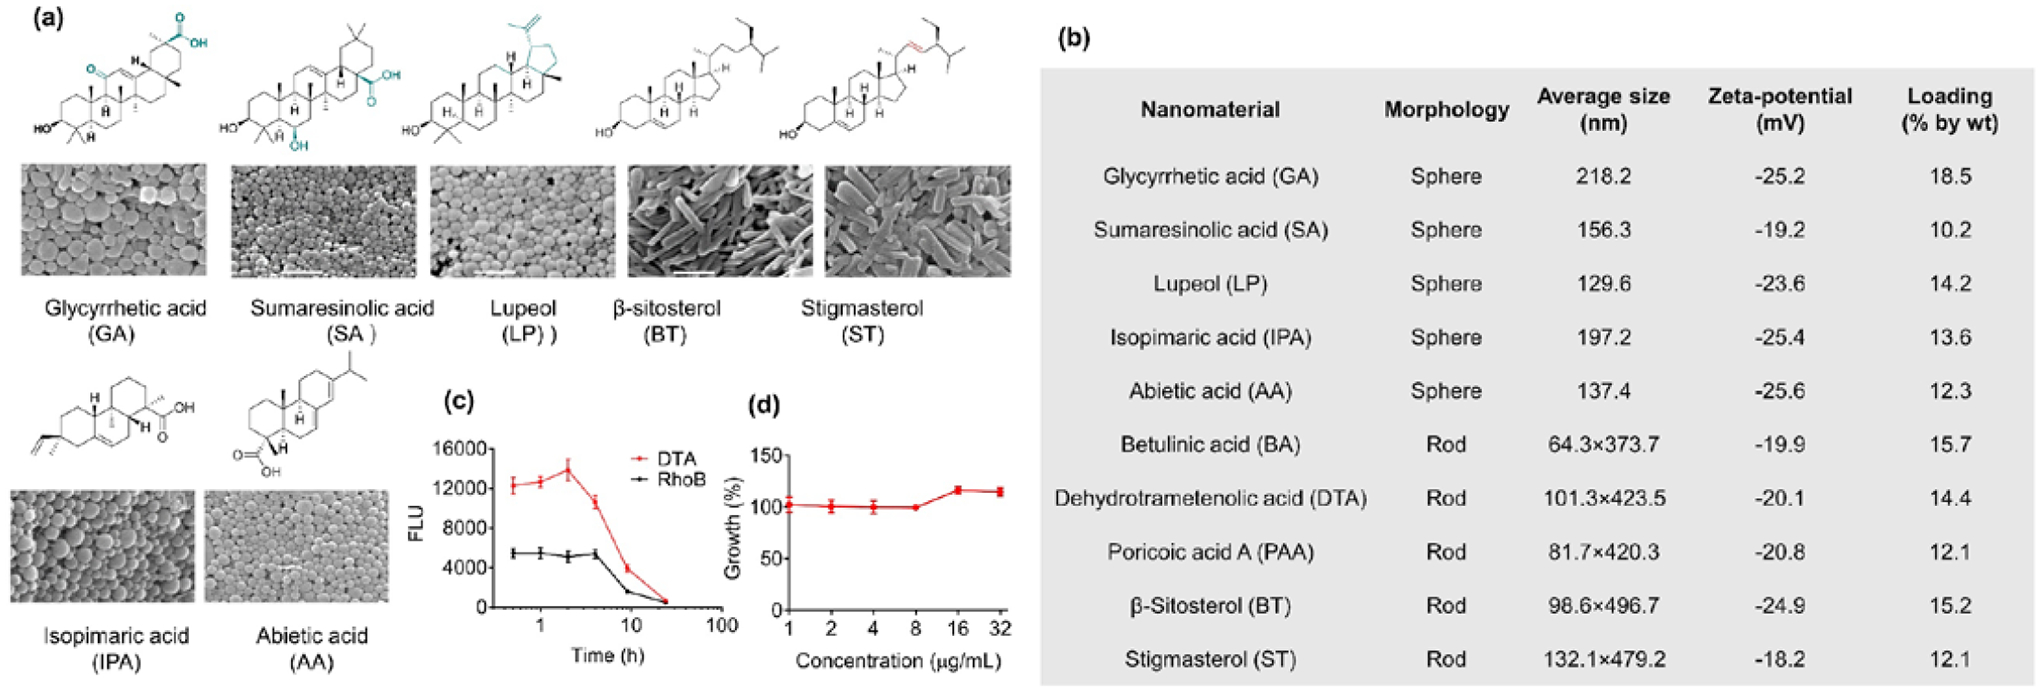
Figure 3.

MNP screen for identification of novel nanomaterials for oral drug delivery. (a) Molecular structures of isolated nanomaterials and NPs derived from those materials. Scale bar: 500 nm. (b) Characterization of NPs derived from the isolated nanomaterials. Drug loading capacity was determined by using PTX as the model drug with 20% feed respect to the weight of nanomaterials (20 mg PTX in 100 mg indicated nanomaterial). (c) Mean levels of Rho fluorescence in the blood – time curves after oral administration of free Rho and Rho-loaded DTA NPs. (d) Growth of Caco-2 cells after treatment with DTA.
