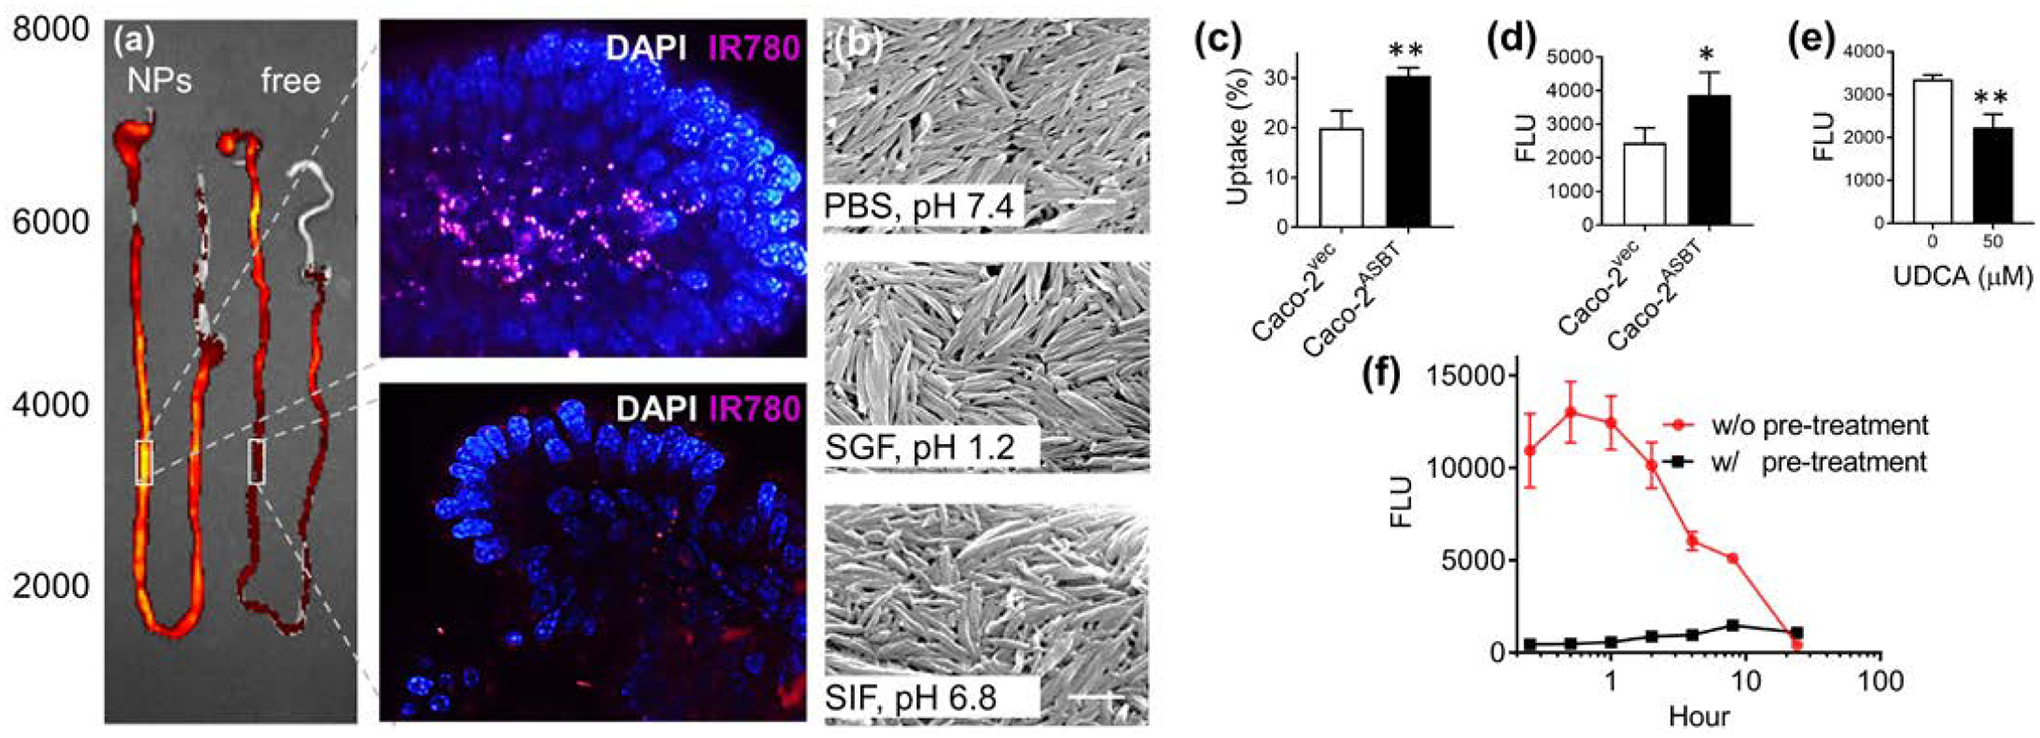
Figure 7.

Molecular mechanism of DTA NP oral uptake. (a) Representative images of the entire GI tract (left) or the indicated intestinal regions isolated from mice received oral administration of IR780-loaded DTA NPs or free dye. Scale bar: 10 μm. (b) SEM images of the DTA NPs after incubation in the indicated medium for 2h. Scale bars: 500 nm. (c) Uptake of DTA NPs increased with ASBT overexpression as determined by flow cytometry. (d) In vitro transport of DTA NPs across monolayers of Caco-2 cell with and without ASBT overexpression. (e) In vitro transport of DTA NPs across monolayers of ASBT overexpressing Caco-2 cells with and without treatment of UDCA. (f) Pretreatment with 500 mg/kg UDCA inhibited the uptake of DTA NPs. *: p < 0.05; **: p < 0.005.
