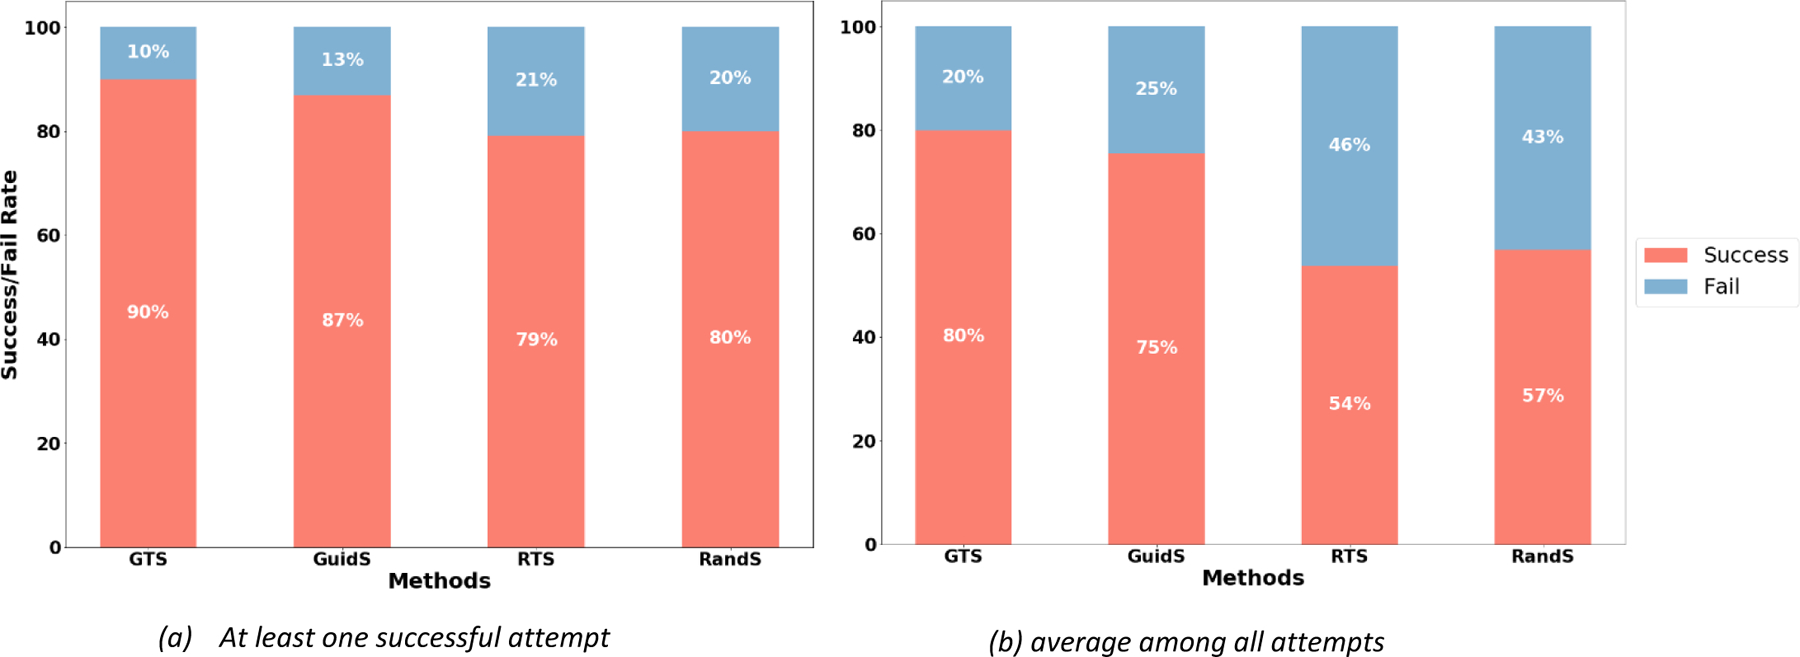
Figure 3.

The rate at which each method successfully found a solution with a lower objective function value than that of the CG solution. Each attempt was limited to 1000 seconds. 3a) The percentages of test cases in which each method found a solution better than CG’s solution in at least 1 of their 5 attempts. 3b) The percentage of test cases in which each method found a solution better than CG’s solution, averaged over all 5 of their attempts to solve the problem.
