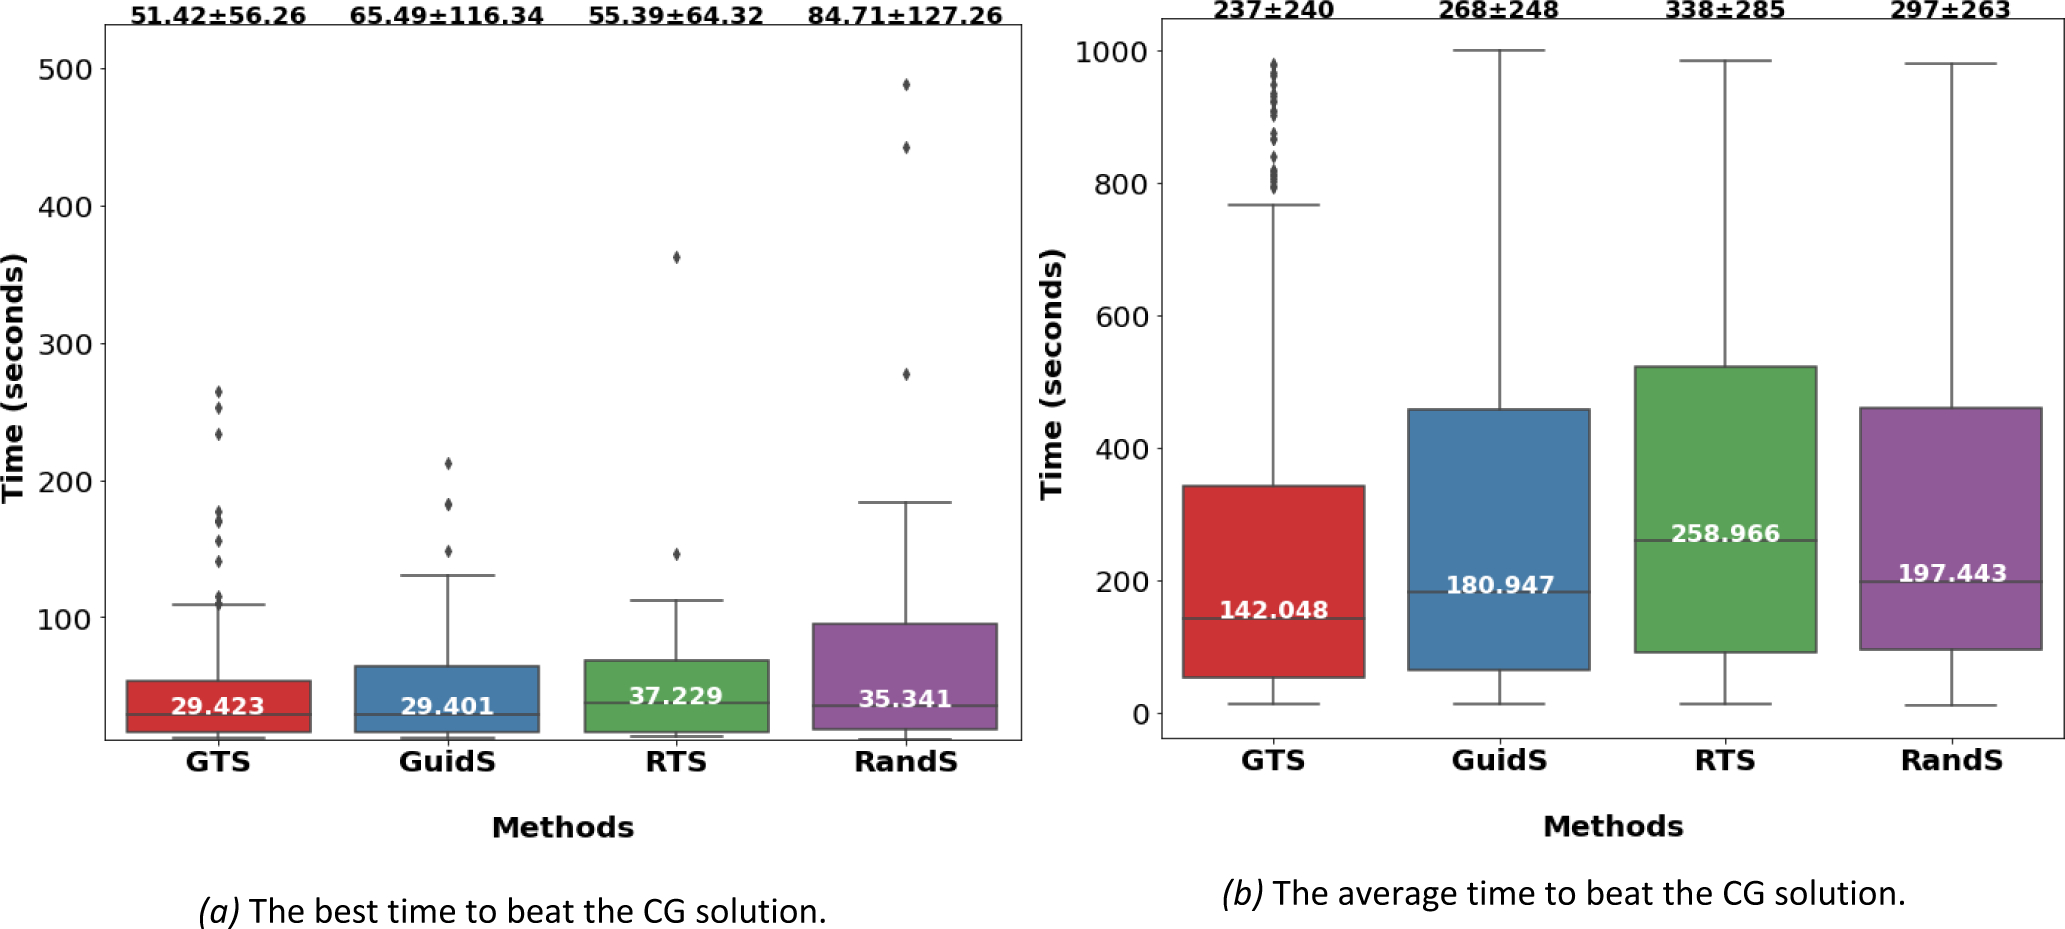
Figure 5:

The computational time comparison between GTS, GuidS, RandS and RTS. a) The first time that each method beats a column generation solution. For this measure only successful scenarios are considered. Mean, standard deviation (at the top of each box as mean plus or minus standard deviation) and median (in the middle of the box) are calculated for each method.
