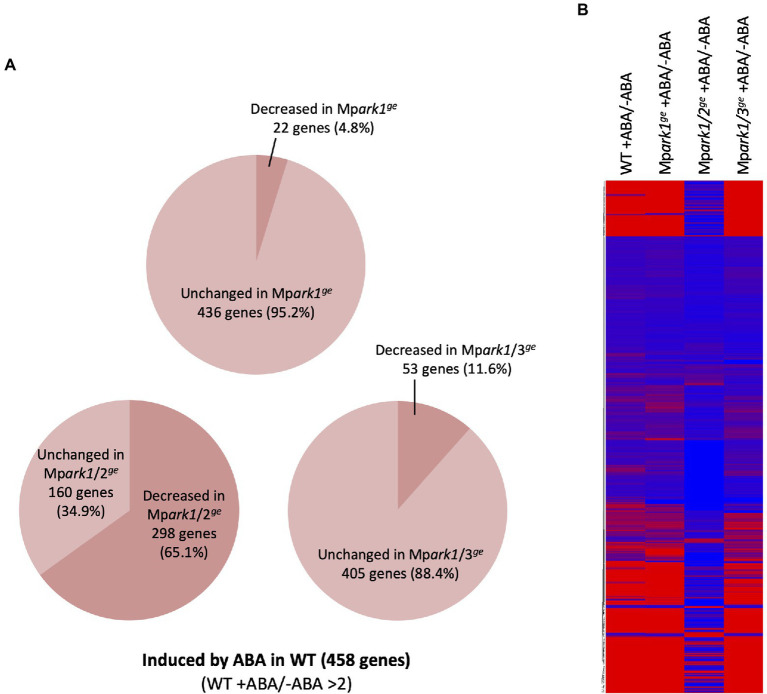
Figure 5.
Profiles of ABA-responsive gene expression in wild type (WT) and the B3-Raf genome-editing lines. (A) Percentages of ABA-induced genes (>2) for which expression was reduced (<2) in the genome-editing lines. (B) Heat map showing ABA-induced and ABA-reduced genes in WT and the genome editing lines. The fold change used for the color key was calculated by comparing values of ABA-treated and control samples.

