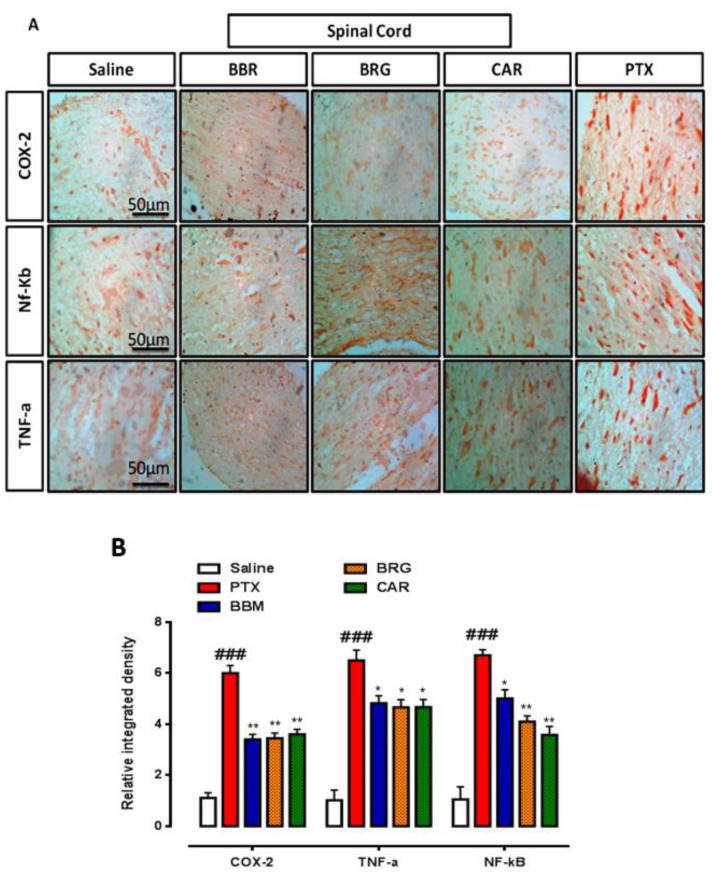
Figure 7.
(A) Representation of immunohistochemistry results for COX-2, TNF-α, and p-NF-κbin the spinal cord of rat. Bar 50 µm, magnification 40x (n = 6/group). (B) Histograms showed comparatively higher expression of COX-2, TNF-α, and p-NF-κb in the PTX group. The data are expressed as the mean ± SEM, n = 6. One-way ANOVA with posthoc Tukey’s test. * p < 0.05 and ** p < 0.01 indicate a significant difference vs. PTX, and ### p < 0.001 indicates a significant difference vs. saline. Morphological data were analyzed by ImageJ software. Bar 50 µm, magnification 40×.

