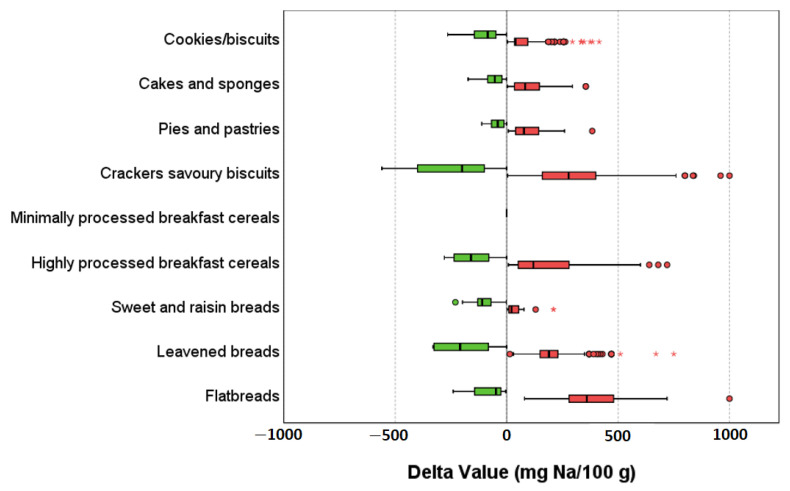
Figure 1.
Box-plot representation of the delta sodium (Na) content from the related benchmarks in the different subcategories of cereal-based products. Legend: green and red bars represent the delta values for products with sodium content equal or below and above the benchmark, respectively. Dots and asterisks represent mild and extreme outliers, respectively.

