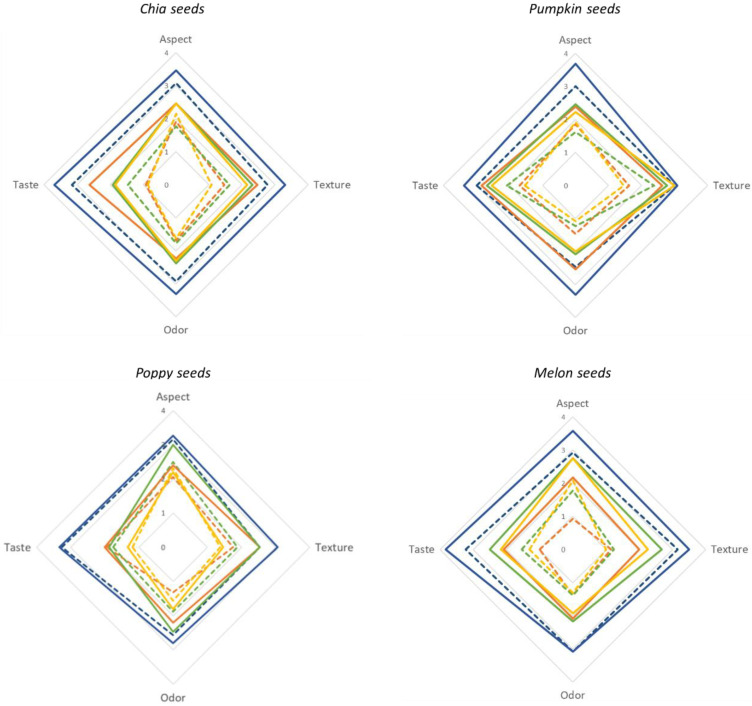
Figure 3.
Radar charts for the sensory evaluation of segmented consumers (neophobic and non-neophobic consumers). Solid lines indicate the values of non-neophobic consumers for the proposed attributes and dotted lines values for neophobic consumers. Blue lines indicate the evaluation of the control sample, orange lines the 50% replacement, green lines 75% replacement and yellow lines 100% replacement. The consumers evaluated the physical aspect, texture, odor, and taste using a 9-point scale (–4: extremely dislike; 0: neither like nor dislike; +4: like extremely).

