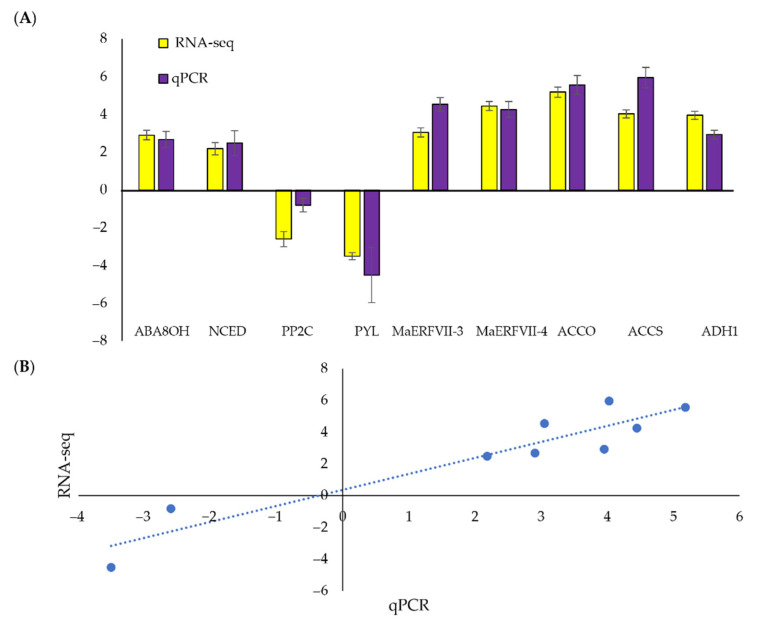
Figure 9.
Comparison of RNA-sequencing and qPCR analyses. (A) The qPCR validation of up-and downregulated differentially expressed genes in waterlogged bananas relative to the well-watered bananas. Values are means ± SE of three biological replicates in qPCR. The expression levels of each gene are expressed relative to the mean values of the control samples. (B) The correlation between qPCR and RNA-sequencing data. [ABA8OH, abscisic acid 8′ hydroxylase; ACCO, 1-aminocyclopropane-1-carboxylic acid oxidase; ACCS, 1-aminocyclopropane-1-carboxylic acid synthase; ADH1, alcohol dehydrogenase 1; NCED, 9-cis-epoxycarotenoid dioxygenase; PYL, PYR-like proteins; PP2C, type 2C protein phosphatase].

