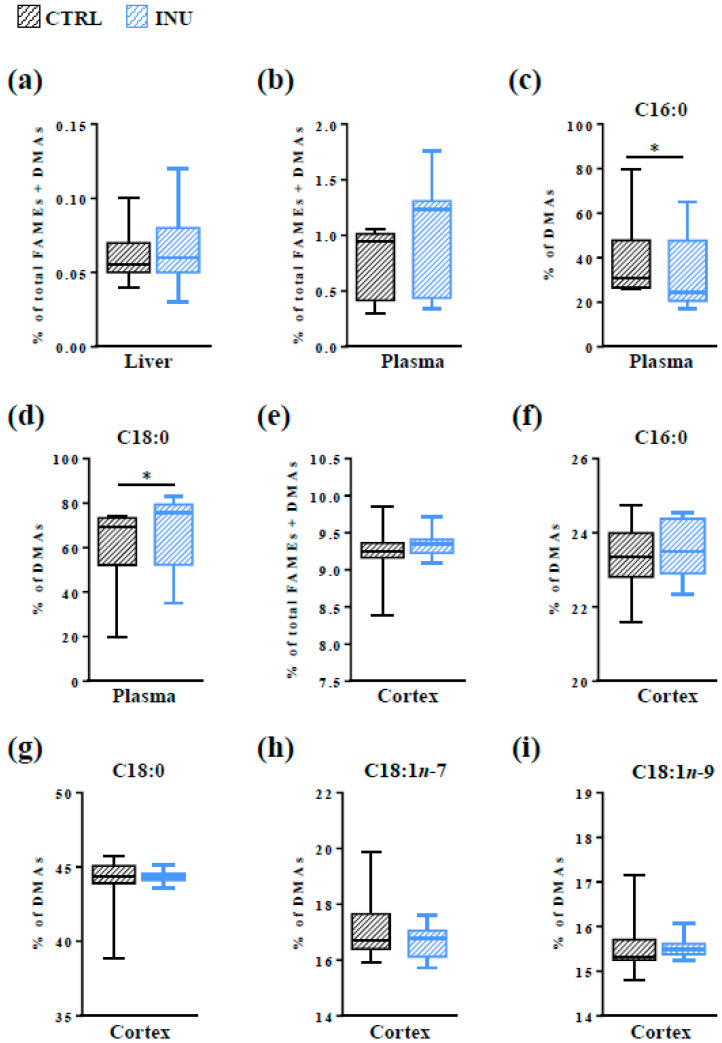
Figure 2.
Evaluation of plasmalogen (Pl) content in the liver, plasma and cortex by GC-FID. The results represent the quantification of dimethylacetals (DMAs, derivatives of aldehyde aliphatic groups from the sn-1 position of Pls) by GC-FID. (a,b,e) Results are expressed as percentages of total DMAs relative to total fatty acid methyl esters (FAMEs) + total DMAs, defined as 100%, in the liver (a), in the plasma (b) and in the cortex (e). (c,d,f–i) percentages of (c,f) DMA 16:0, (d,g) DMA 18:0, (h) DMA 18:1n-7, and (i) DMA 18:1n-9 relative to total DMAs (defined as 100%), in the plasma (c,d) and in the cortex (f–i). CTRL: mice fed a control diet. INU: mice fed a diet supplemented with inulin. Data are presented in box and whisker plot format (median; min. to max.). Mann–Whitney test for comparison of lipid abundance between CTRL and INU mice, * p < 0.05. GC-FID, gas chromatography with flame-ionization detection.

