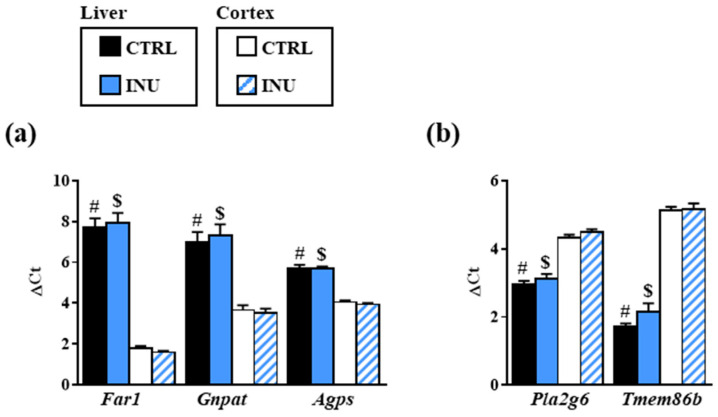
Figure A1.
Expression levels of genes encoding enzymes involved in the biosynthesis (a) or in the degradation (b) of plasmalogens in liver and cortex of mice fed a control diet or a diet supplemented with inulin. (a) Expression levels of genes encoding fatty acyl-CoA reductase 1 (Far1), DHAP-AT/DAP-AT (Gnpat), and alkyl-DHAP synthase (Agps). (b) Expression levels of genes encoding phospholipase A(2) (Pla2g6) and lysoplasmalogenase (Tmem86b). DeltaCt (ΔCt) are presented as mean ± SEM. #, p < 0.0001, Mann–Whitney test for comparison between ΔCt in liver and ΔCt in cortex of control group (CTRL) mice. $, p < 0.0001, Mann–Whitney test for comparison between ΔCt in liver and ΔCt in cortex of inulin group (INU) mice. acyl-CoA, acyl coenzyme A; SEM, standard error of the mean.

