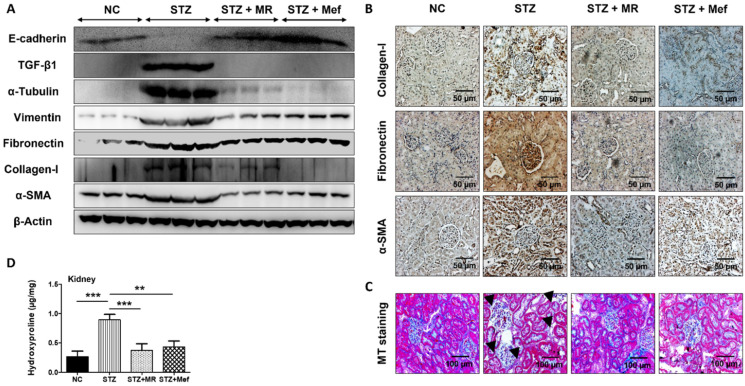
Figure 4.
Effects of the MR extract on expression of renal fibrosis biomarkers in STZ-treated rats. (A) Expression pattern of E-cadherin, TGF-β1, α-tubulin, vimentin, fibronectin, collagen-1, and α-SMA in the kidney of rats, as determined by western blotting. β-Actin was used as the loading control. The results represent three independent experiments. (B) Immunohistochemical analysis of collagen-I, fibronectin, and α-SMA in the kidneys of animals from all groups. Original magnification: 200×, scale bar: 50 μm. (C) Images of kidney sections stained with Masson’s trichrome, which indicated renal collagen deposition (blue). Original magnification: 200×, scale bar: 100 μm. (D) Level of 4-hydroxyproline content in the serum of STZ-treated rats. Data are expressed as the mean ± S.D. of duplicate experiments (n = 6). Statistical analysis was performed by one-way ANOVA followed by Tukey’s HSD post hoc test for multiple comparisons (*** p < 0.001, ** p < 0.01). NC: Normal control, STZ: streptozotocin-treated group, STZ + MR: Streptozotocin-treated rats received MR extract, STZ + Mef: Streptozotocin-treated rats received Metformin.

