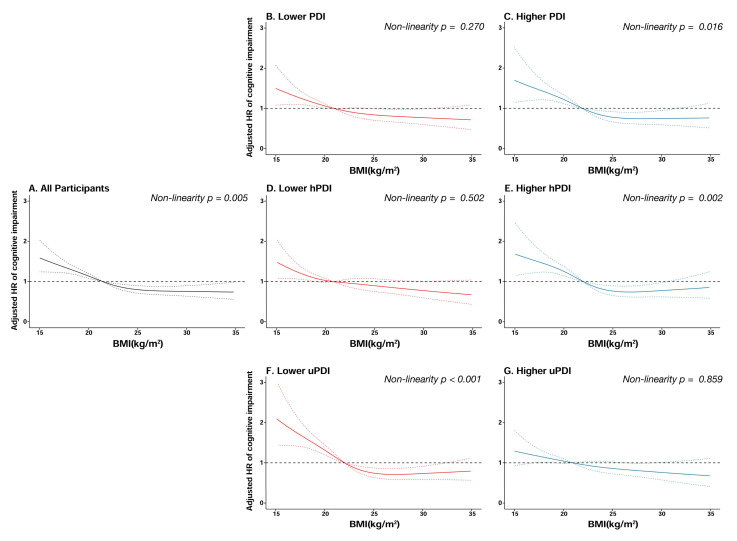
Figure 2.
Cubic splines for the associations of baseline BMI with cognitive impairment, stratified by plant-based diet indices. (A): all participants; (B): lower plant-based diet index (PDI); (C): higher plant-based diet index (PDI); (D): lower healthful plant-based diet index (hPDI); (E): higher healthful plant-based diet index (hPDI); (F): lower unhealthful plant-based diet index (uPDI); (G): higher unhealthful plant-based diet index (uPDI).

