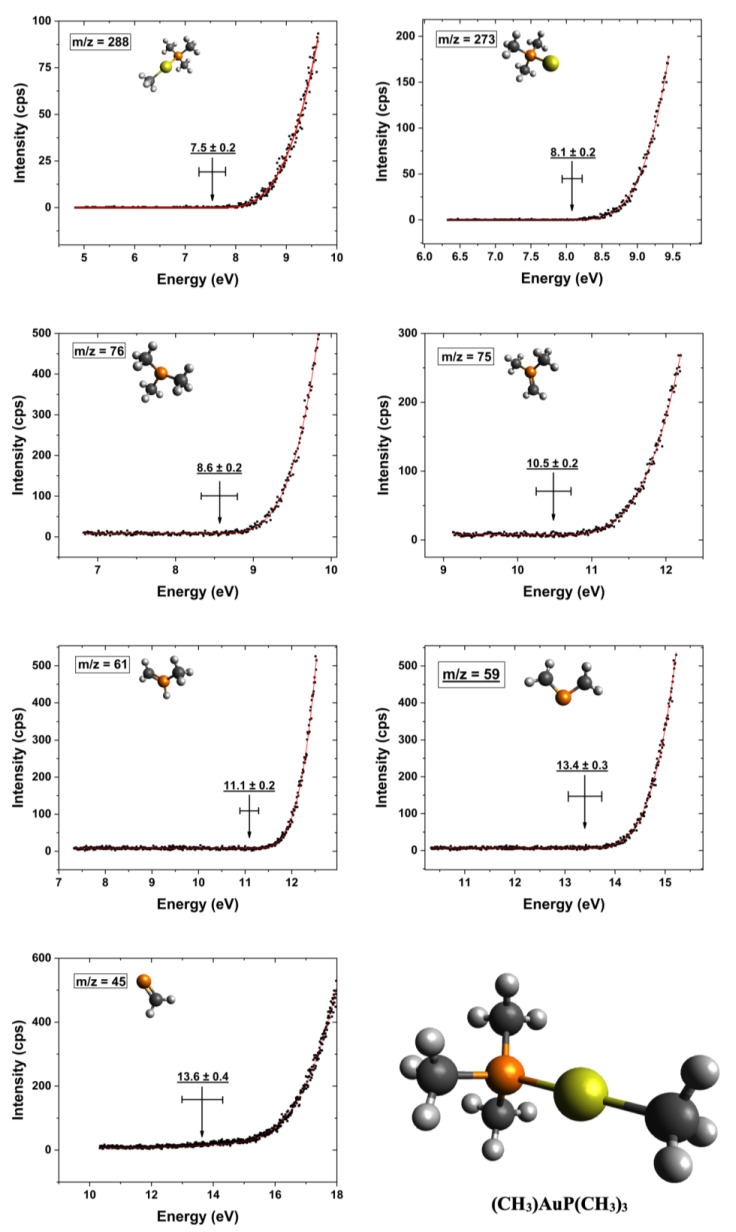
Figure 4.
Representative fits to the onset region of the DI ion yield curves for the parent cation and the most dominant positively charged fragments from the (CH3)Au(CH3)3 precursor. The respective Wannier-type fits, appearance energies, and their confidence limits for each ion yield curve are shown, and the respective chemical structure of the intact parent molecule is shown in the right corner.

