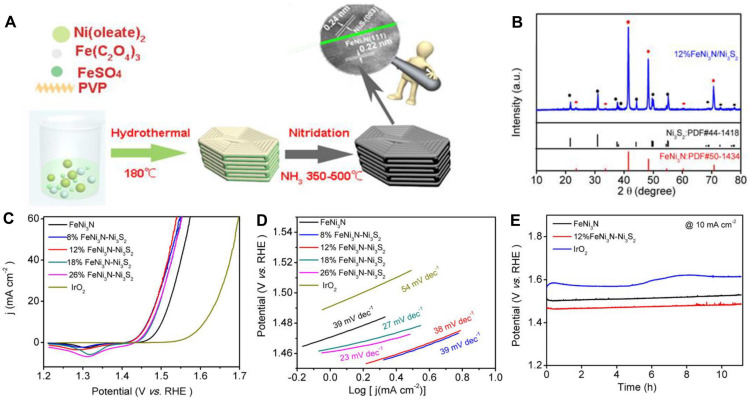
Figure 7.
(A) Schematic illustration of the formation of FeNi3N-Ni3S2 samples; (B) XRD pattern of FeNi3N-Ni3S2; (C) LSV curves of different electrocatalysts in 0.1 M KOH electrolyte; (D) Tafel plots of different electrocatalysts; (E) potential cycling performance of FeNi3N-Ni3S2, FeNi3N, and IrO2. Reproduced with permission from [91]. Copyright © 2020 American Chemical Society.

