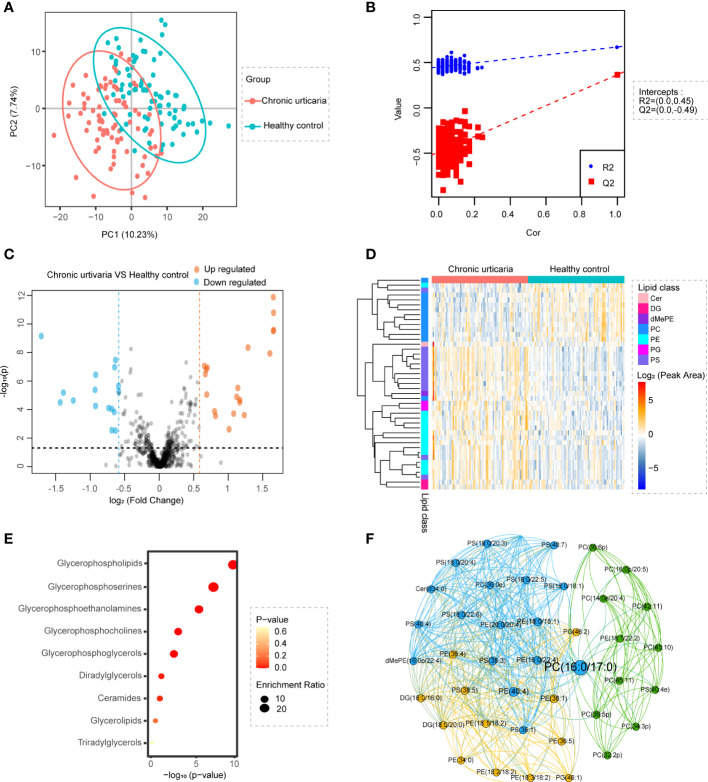
Figure 1.
Identification of lipid profiling in plasma of CU. (A) PLS-DA score plots show discrimination between the HC (blue) and CU (red). (B) Validation plots were obtained from 200 permutation tests (R2 = 0.672, Q2 = 0.365). (C) Volcano map of differentially expressed lipids between CU and HC groups. Blue represents the down-regulated lipid molecules, orange represents the up-regulated lipid, and non-significant lipid molecules are gray. Molecules, solid and round represent the lipid molecules VIP ≥1, hollow and round represents the lipid molecules VIP < 1. (D) Heatmap of the top 7 differentially lipids between HC and CU. Each row in the figure represents a differential lipid, and each column represents a sample. Different colors indicate different intensities, and colors range from blue to red, indicating strength from low to high. (E) Lipid metabolites set enrichment analysis for CU. Redder colors represent lower P values, and larger circles represent higher enrichment ratios. Low P-value and large enrichment ratio indicate that this pathway is enriched more. (F) The correlation analysis of different lipids showed that the same lipids had a good correlation.

