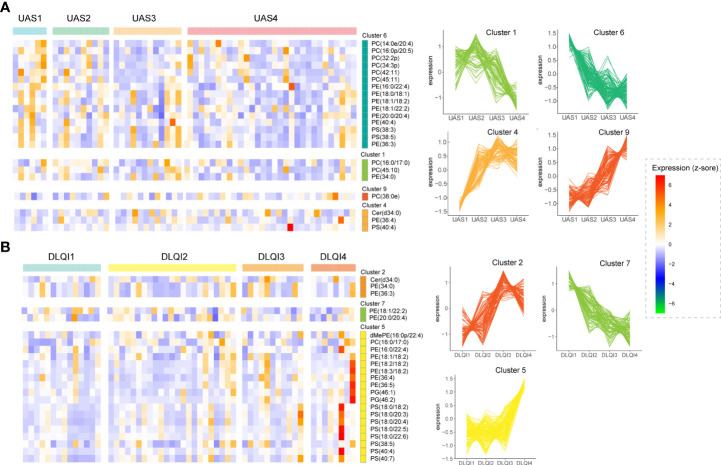
Figure 2.
Alterations in lipids are related to the clinical characteristics of CU. Heatmaps of lipid clusters grouped by different UAS7 (A) and DLQI (B) scores are shown on the left. The abscissa marks the specific scoring groups, and the ordinate marks the cluster and the major lipids in that cluster. The cut squares in the figure correspond to groups and clusters. Clusters with significant trends are on the right.

