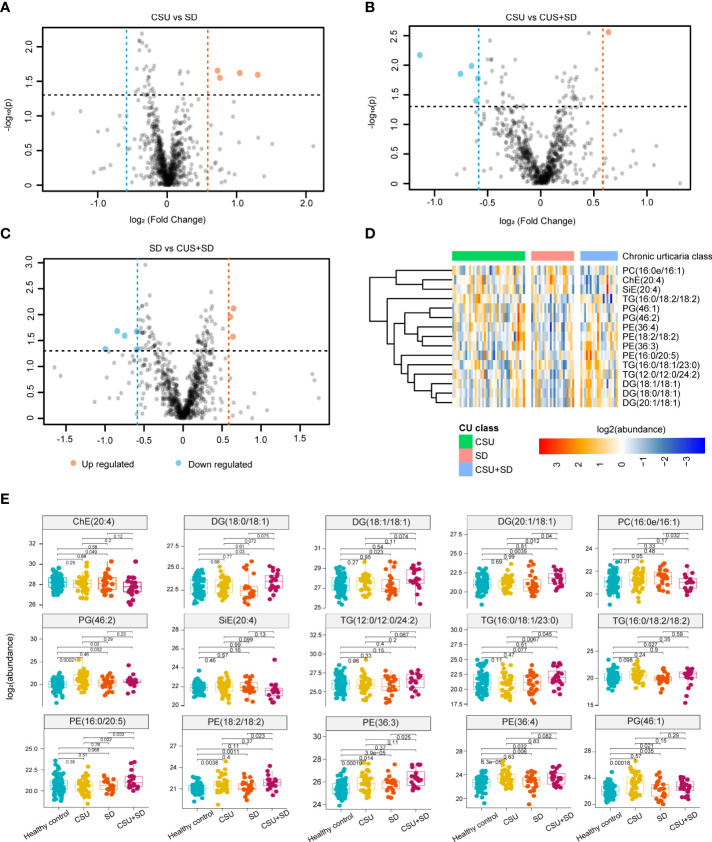
Figure 3.
Identification of Lipid signatures in subtypes of CU. (A-C) Comparative analysis of lipid abundance between three groups of different types of urticaria as shown in the volcanic diagram. Blue represents the down-regulated lipid molecules, orange represents the up-regulated lipid, and non-significant lipid molecules are gray. (D) Heatmap of the top 15 differentially expressed metabolites. Different colors indicate different intensities, and colors range from blue to red, indicating strength from low to high. (E) Boxplot of the 15 significantly altered lipids. Blue represents the HC, yellow represents the CU, orange represents the SD, and purple presents the CSU+SD. The y-axis is the normalized intensity after log2 transformation.

