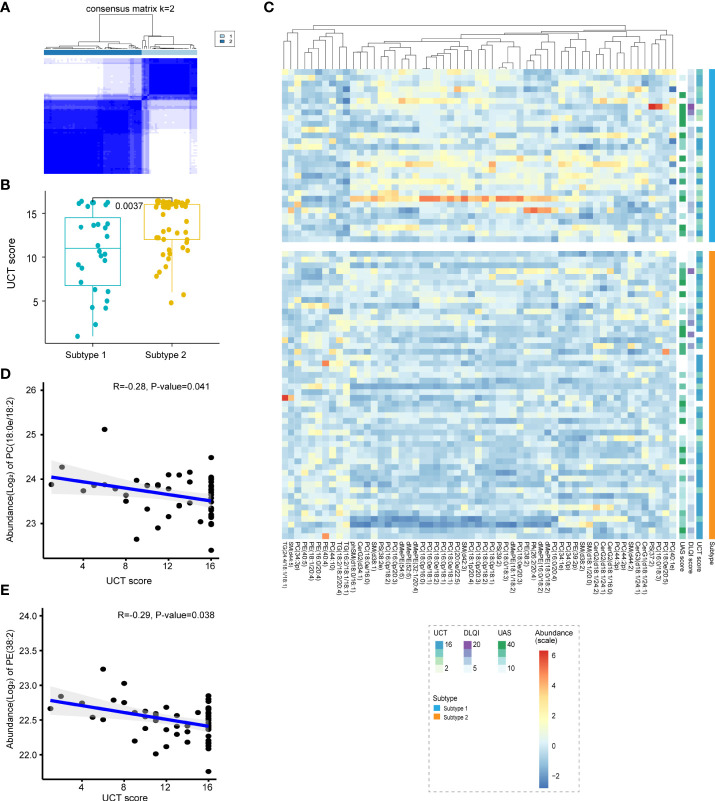
Figure 4.
Classification of CU lipid subtypes based on profiling. (A) The heat map corresponding to the consensus matrix for 2 metabolite subtypes was obtained by applying consensus clustering. (B) CU was classified into two subtypes based on lipid profiling, subtype 2 shared higher UCT scores compared with subtype 1. (C) The heatmap of all differential lipids related with subtype 1 (blue) and subtype 2 (orange), which was generated using the heatmap function in R with subtypes, UAS7 (green), DLQI (purple) score and UCT (blue) score as the annotations. The colors range from blue to red, indicating strength from low to high. (D, E) Plasma PC (18:0e/18:2) (R=-0.28, P-value=0.041) and PE (38:2) (R=-0.29, P-value=0.038) levels were negatively correlated with UCT scores.

