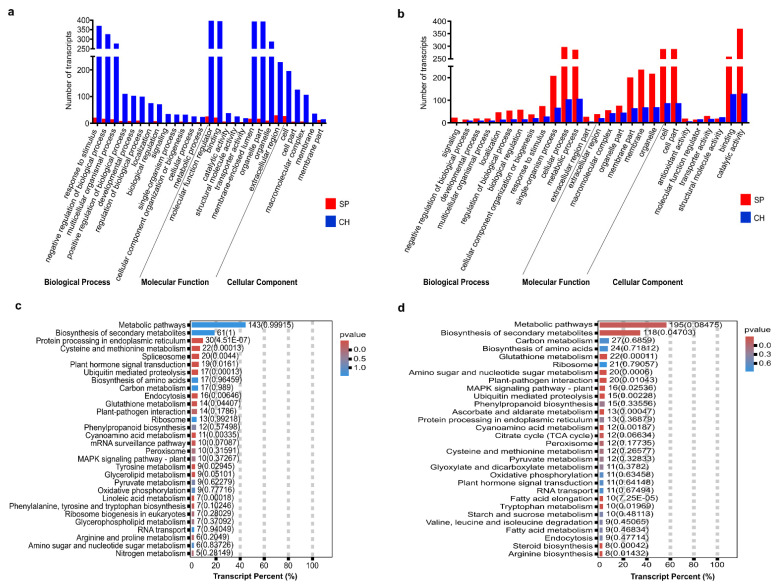
Figure 3.
Analysis of DETs between BNF-contrasting genotypes that show a common pattern of regulation in stalks and hydroponics. (a,b) The figures show the number of differentially expressed transcripts that are more represented in GO categories. Red represents the number of the upregulated transcripts in SP, and blue in CH. (a) shows data of roots and (b) shows data of shoots. (c,d) The graphs show the KEGG enrichment analysis (c) in roots and (d) in shoots. Only the most represented classes in the sugarcane reference transcriptome were displayed. KEGG enrichment analysis of DETs was carried out through OmicShare tools.

