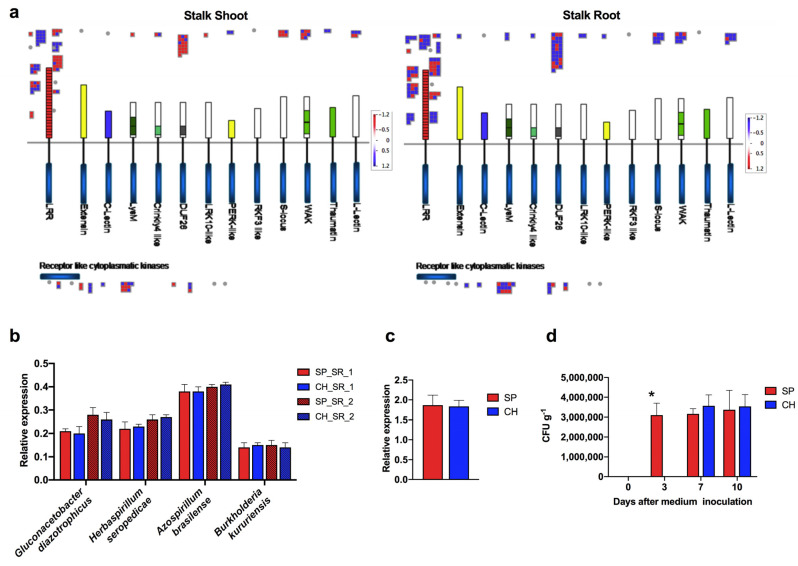
Figure 5.
Evaluation of biotic stress response pathways differentially regulated between BNF-contrasting genotypes and bacteria colonization. (a) Schematic representation of different plant receptor families, showing the DETs identified in shoot and root tissues of germinated stalks. In red are represented the transcripts that are more expressed in SP and in blue are represented the ones more expressed in CH. (b) Relative levels of G. diazotrophicus, H. seropedicae, A. brasilense and B. kururiensis colonizing sugarcane were measured by qRT-PCR of bacterial 23S rRNA in germinated stalks 15 days after planting. Bacterial 23S rRNA levels were normalized with plant 28S rRNA and GAPDH levels. Bars represent mean ± standard deviation of the relative mRNA expression in three biological replicates (three plants) and each biological replicate analyzed with three technical replicates. (c) Relative levels of G. diazotrophicus colonizing sugarcane were measured by qRT-PCR of bacterial 23S rRNA in hydroponic cultured plants 10 days after inoculation with G. diazotrophicus. Bacterial 23S rRNA levels were normalized with plant 28S rRNA and GAPDH levels. Bars represent mean ± standard deviation of the relative mRNA expression in two biological replicates (three plants) and each biological replicate analyzed with three technical replicates. (d) Quantification of bacterial numbers of SP and CH plants grown in hydroponic culture and inoculated with G. diazotrophicus using MPN assay. Analyses were performed 0, 3, 7 and 10 days after inoculation. Bars represent mean ± standard error of the relative mRNA expression in three biological replicates (three plants) and each biological replicate analyzed with three technical replicates. Asterisk marks statistical significance between SP and CH (* p < 0.05), performed by statistical t-test.

