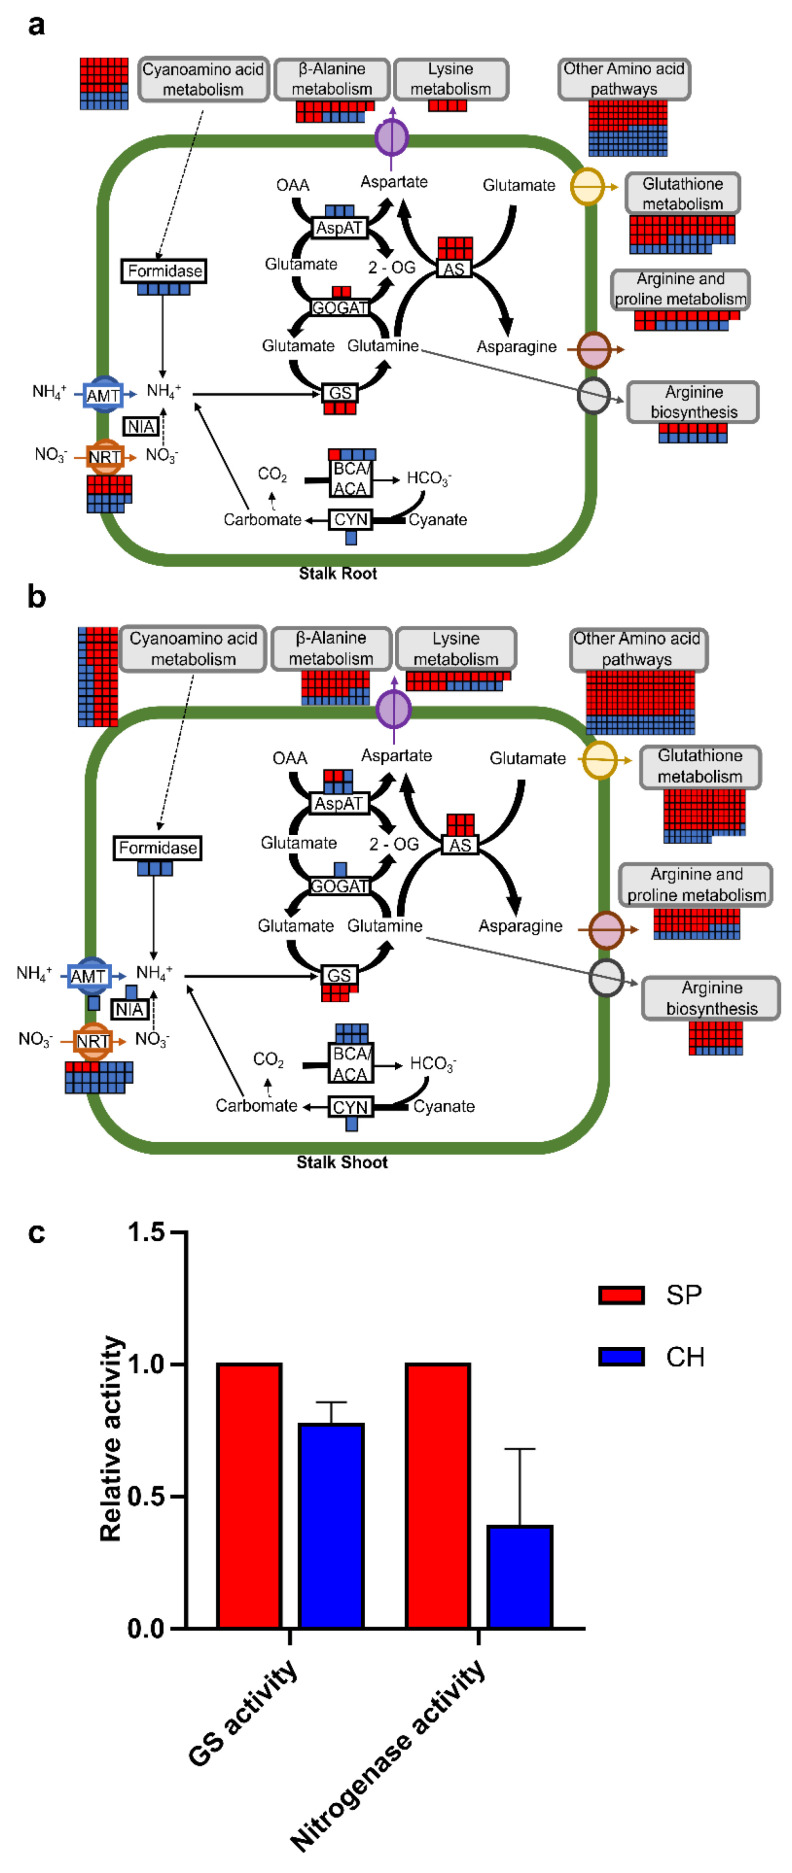
Figure 6.
Evaluation of nitrogen and amino acid metabolism pathways differentially regulated between BNF-contrasting genotypes. Schematic representation of N assimilation and transport, showing the DETs identified in root (a) and shoot (b) tissues of germinated stalks. In red are represented the transcripts that are more expressed in SP and in blue are represented the ones more expressed in CH. (c) Enzyme activity of GS and nitrogenase was evaluated in 15-day germinated stalks and is represented as relative activity in relation to SP70-1143 values. Bars represent mean ± standard deviation of five biological replicates. Asterisks (*) represent significant differences between SP and CH through t-test (p < 0.05). GOGAT—glutamate synthase; GS—glutamine synthetase; AS—asparagine synthetase; NIA—nitrate reductase; NRT—nitrate transporter protein; AMT—ammonium transporter; 2-OG—2-oxoglutarate; Gln—glutamine; Glu—glutamate; Asn—asparagine; NO3−—nitrate; NH4+—ammonium; BCA—beta carbonic anhydrase; ACA—alfa carbonic anhydrase; AspAT—aspartate aminotransferase; OAA—oxaloacetate.

