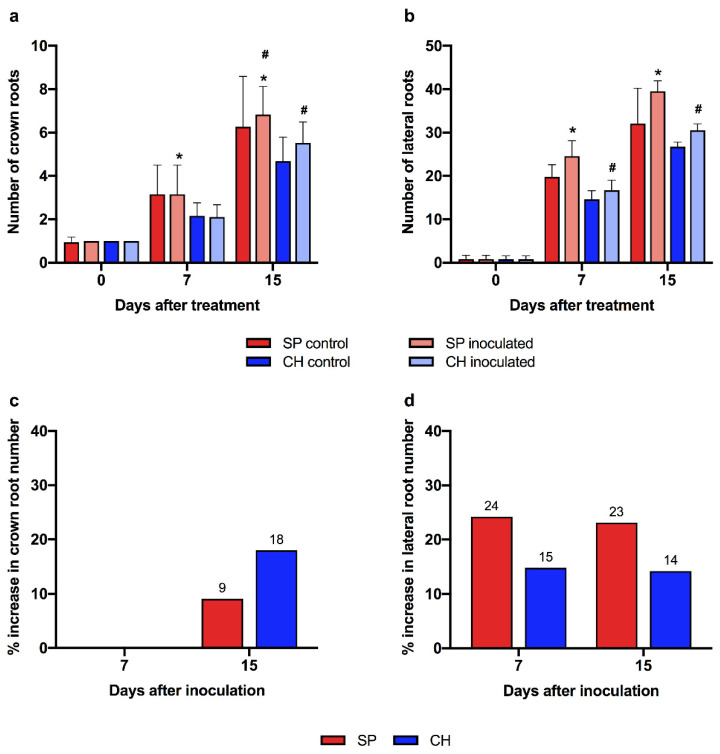
Figure 10.
Analysis of root growth in the contrasting genotypes treated with 2 mM NAA in hydroponics. Evaluation of (a) crown and (b) lateral roots, and % of increase in (c) crown and (d) lateral root number in plants treated with 2 mM NAA. Analyses were performed 0, 7 and 15 days after treatment. The symbol (*) indicates significant differences between SP and CH control plants at the same time point. The symbol (#) indicates significant differences between control and NAA treated plants of the same genotype at the same time point. Bars indicate mean ± standard error of three independent experiments.

