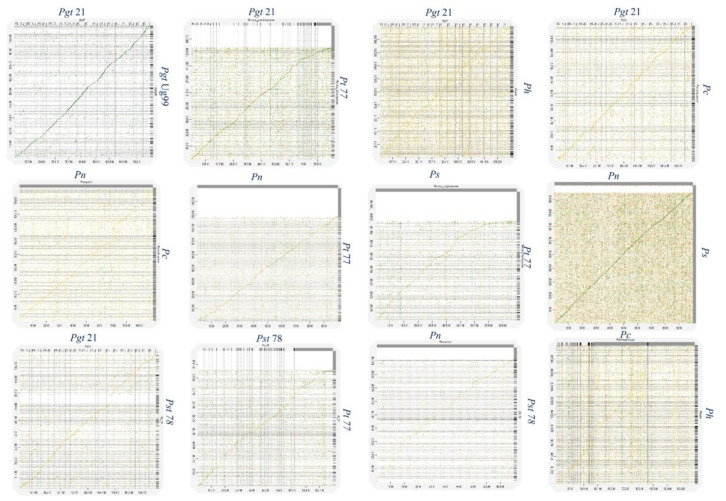
Figure 3.
Synteny plots of P. novopanici genome with other Puccinia genomes. Figures represent synteny dot plots generated by D-GENIES (http://dgenies.toulouse.inra.fr/, accessed 28 June 2022). All Puccinia genomes studied were individually compared with each other. Good synteny, represented by a continuous linear line, is observed between Pn and Ps; Pgt 21 and Pt BBBD1; Pn and Pt BBBD1; Ps and Pt BBBD1; Pst 78 and Pt BBBD1. Abbr: Puccinia graminis tritici (Pgt); Puccinia striiformis tritici (Pst); Puccinia triticina (Pt); Puccinia coronata avenae (Pca); Puccinia novopanici (Pn); Puccinia sorghi (Ps).

