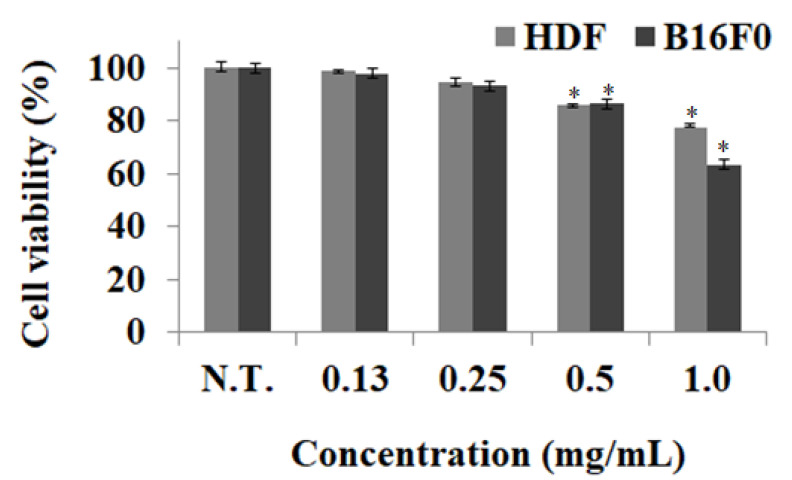
Figure 3.
Inhibitory effects BCS on cell viability of HDF and B16F0. BCS: bioconverted chestnut inner shell extracts. The cell growth of the control group with the nontreated group (N.T.) at 24 h was represented as 100%. Results represent mean ± standard deviation (n = 3). The statistical analysis of the data was carried out by use of a t-test. Values are statistically significant at * p < 0.05 vs. respective control group.

