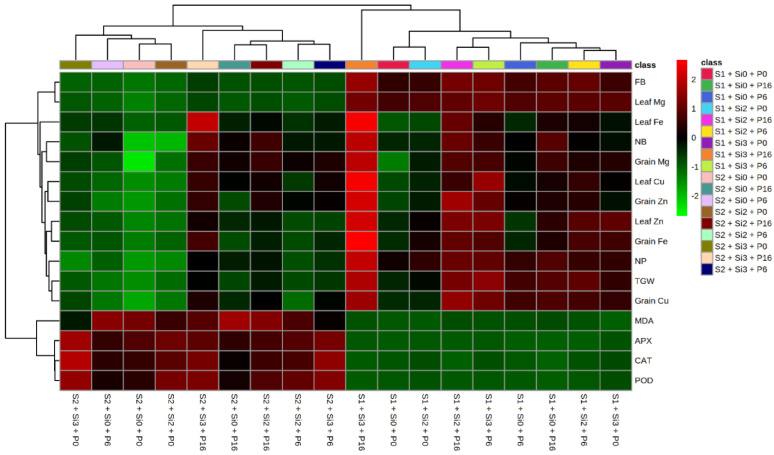
Figure 2.
Heat map along hierarchical clustering of all observed variables in response to salinity stress with the applications of silicon (Si) and plant growth promoting bacteria (PGPR) in mung bean crop. Classes on sidebar represent the complete combinations of all set of treatments as P0 = Un-inoculated control, P6 = E. cloacae, P16 = B. drentensis, Si 0 = 0 kg Si ha−1, Si 1 = 1 kg Si ha−1, Si 2 = 2 kg Si ha−1, S1 = Saline irrigation at 3.12 dS m−1, S2 = Saline irrigation at 7.81 dS m−1. Side bar having gradual intensity of red and green colors shows increase or decrease in the concentration of various attributes, respectively. The complete forms of the abbreviations used for variables are FB, Fresh biomass; NP, Number of pods; NB, Number of branches; TGW, Thousand grain weight; Mg, Magnesium; Fe, Iron; Zn, Zinc; Cu, Copper; MDA, Malondialdehyde; APX, Ascorbate Peroxidase; CAT, Catalase; POD, Peroxidase.

