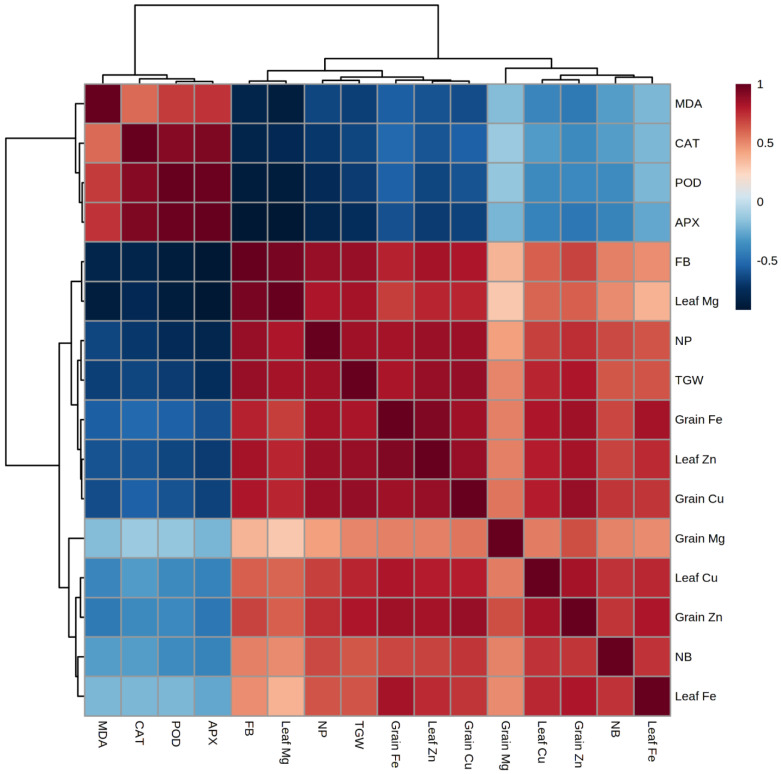
Figure 3.
Pearson correlation with various colors showing the strength of relationship of all observed parameters. Side bar having gradual intensity of brown and blue colors depicts strength of association either positive or negative, respectively, according to the color pattern. The complete forms of the abbreviations used for variables are FB, Fresh biomass; NP, Number of pods; NB, Number of branches; TGW, Thousand grain weight; Mg, Magnesium; Fe, Iron; Zn, Zinc; Cu, Copper; MDA, Malondialdehyde; APX, Ascorbate Peroxidase; CAT, Catalase; POD, Peroxidase.

