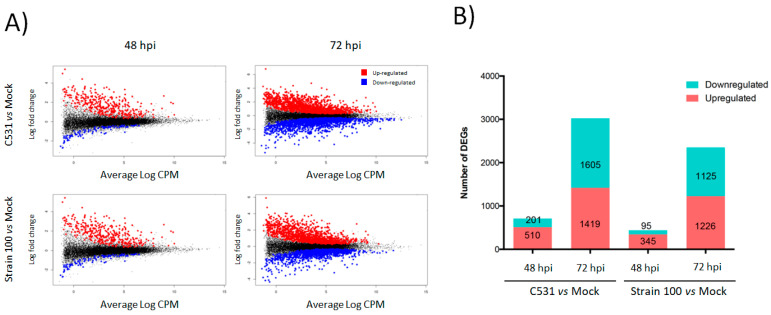
Figure 2.
Global overview of the P. vulgaris transcriptomic response to inoculation with C. lindemuthianum under compatible (Strain 100) and incompatible interaction (C531). (A) LogCPM expression vs. Log2 fold change plots (MA-plots) were calculated for inoculated vs. Mock condition at each time point. Significant DEGs with adjusted p-value < 0.05 are plotted in red (Up-regulated) and blue (Down-regulated). (B) Numbers of significant DEGs in inoculated plants vs. Mock condition at each time point.

