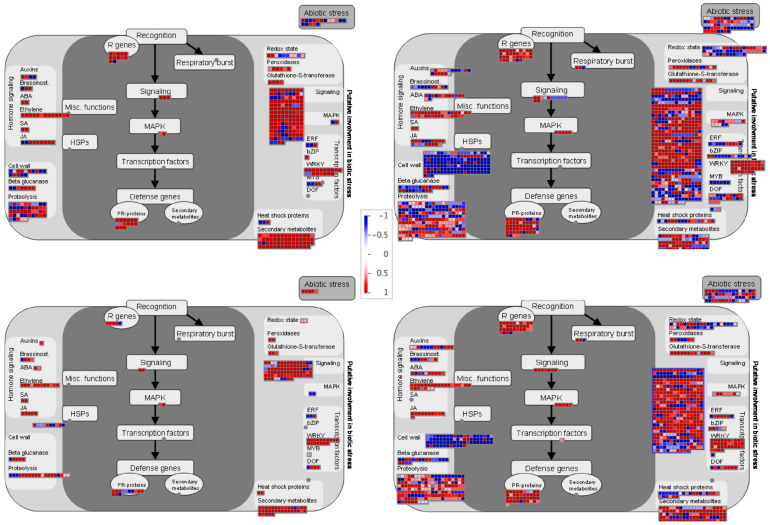
Figure 6.
MapMan overview of the biotic stress pathway of DEGs in BAT93 inoculated plants during compatible and incompatible interactions at 48 hpi and 72 hpi. DEGs are represented by squares colored in red (Up-regulated) or blue (Down-regulated) following the scale bar displaying changes in gene expression values in LogFC (Center).

