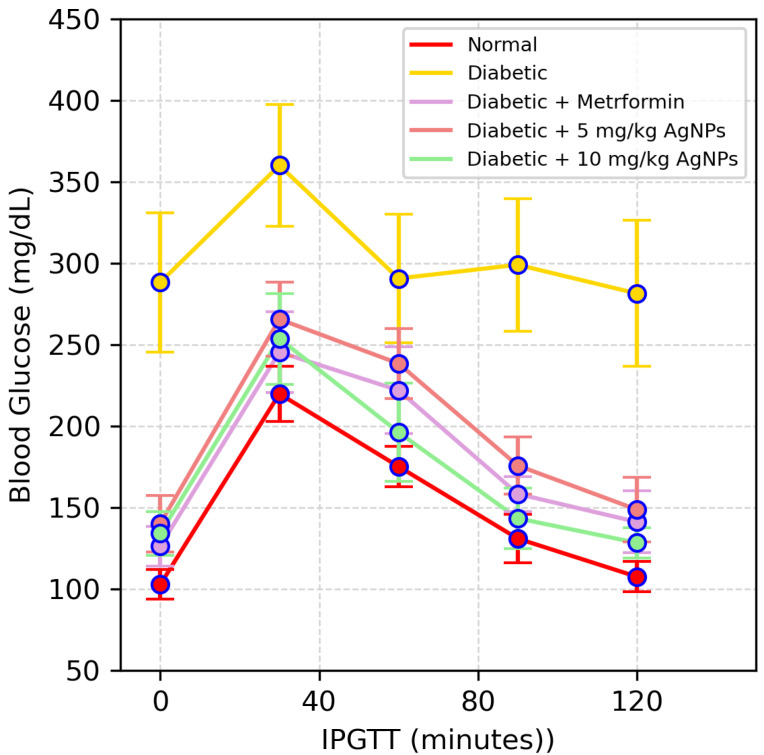
Figure 13.
IPGTT results of the healthy, diabetic, metformin-treated and AgNP-treated low (5 mg/kg) and high dose (10 mg/kg) mice post treatment. The statistical significance of differences among different groups was analyzed using Two Way ANOVA Bonferroni test as implemented in Graph pad prism 5.0 software.

