. 2022 Jul 28;22(15):5659. doi: 10.3390/s22155659

Table 2.

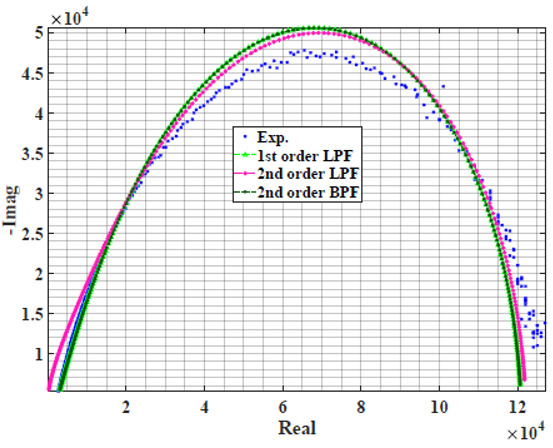
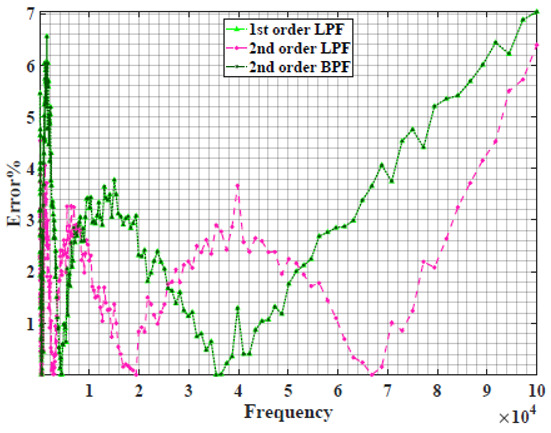
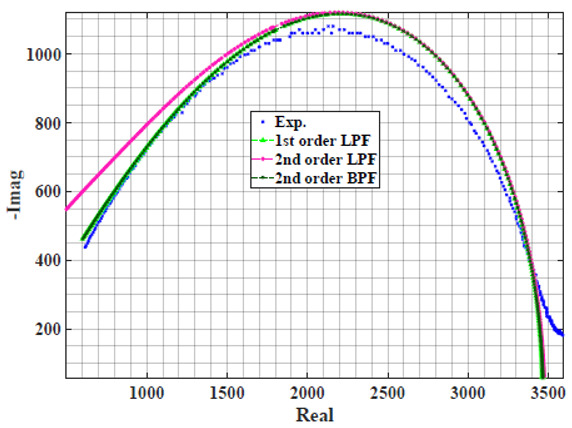
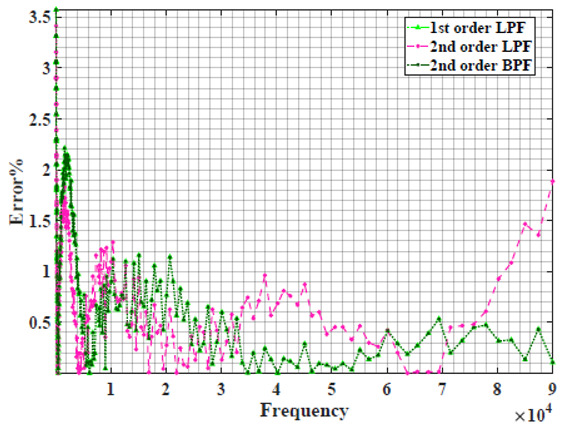
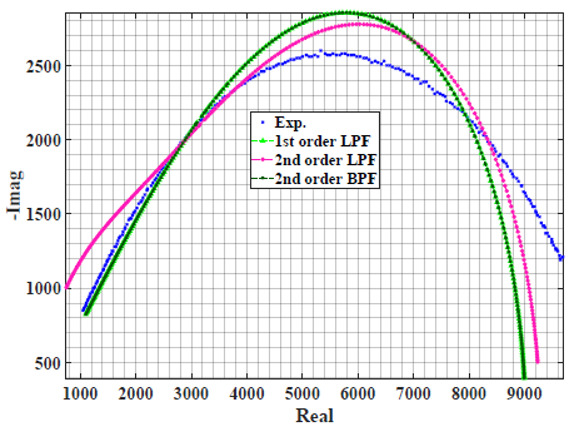
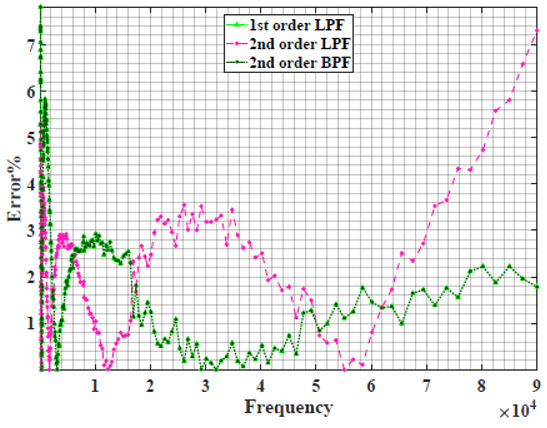
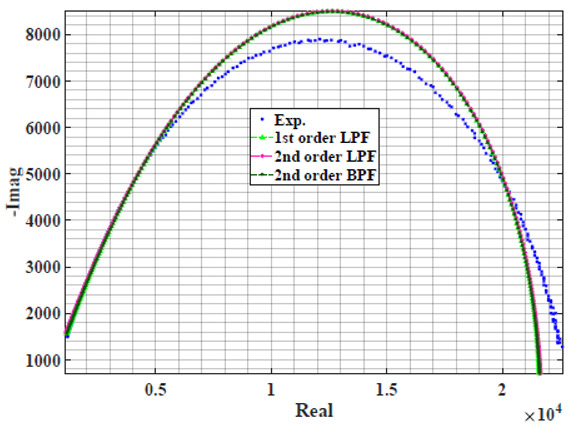
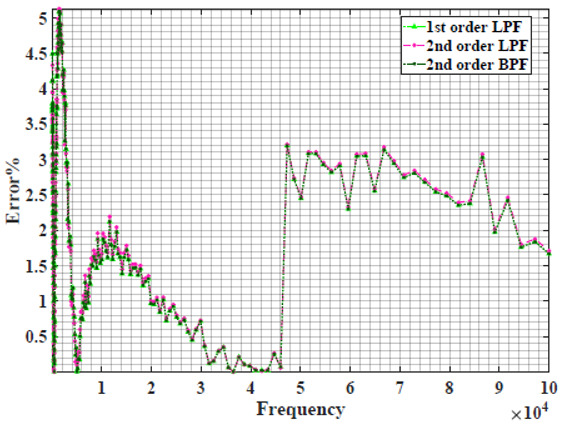
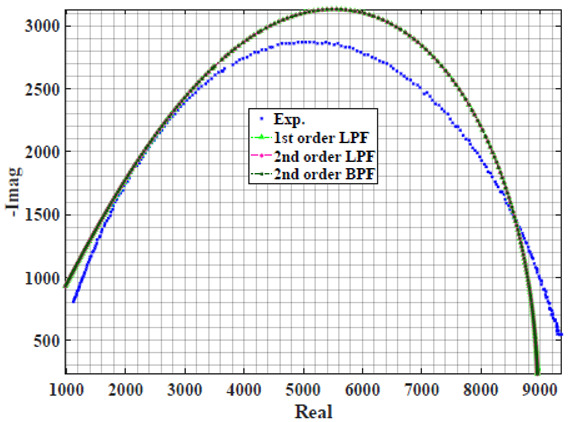
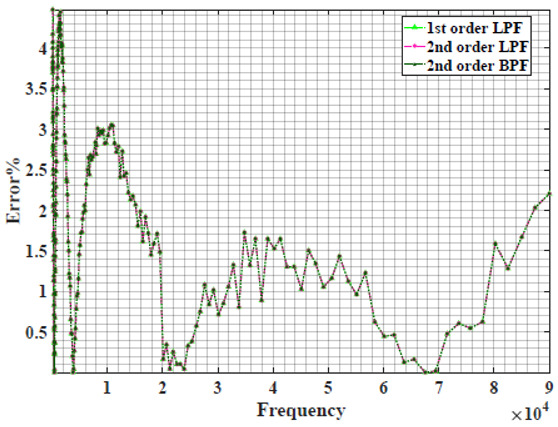
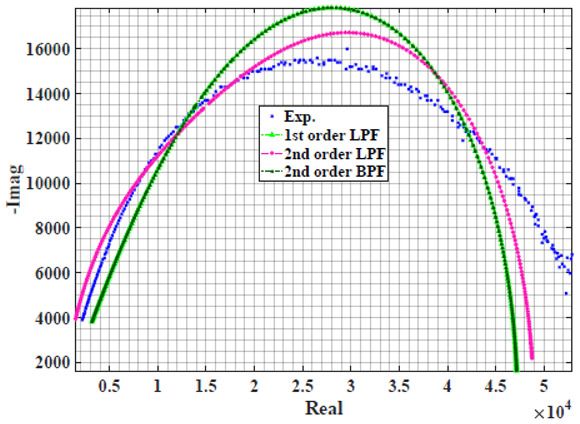
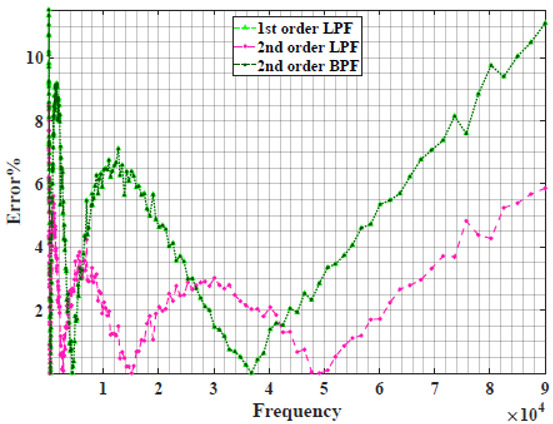
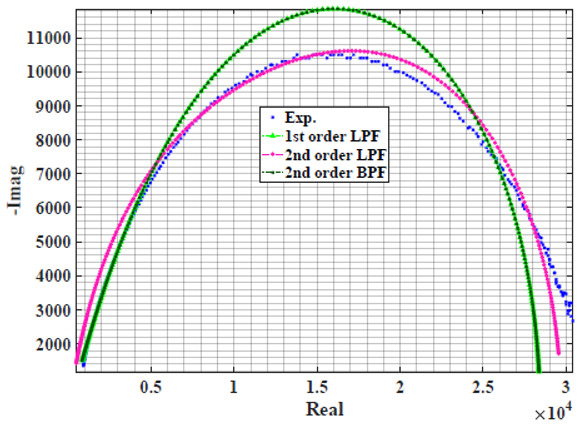
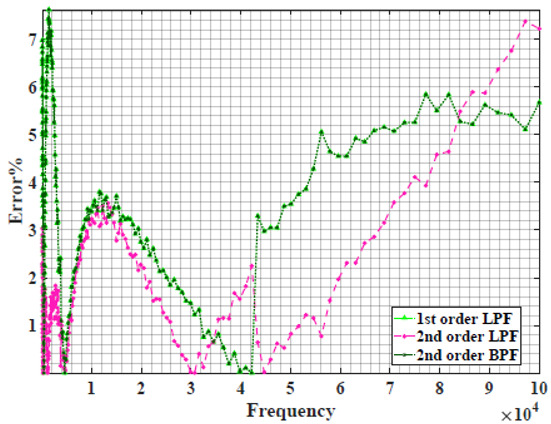
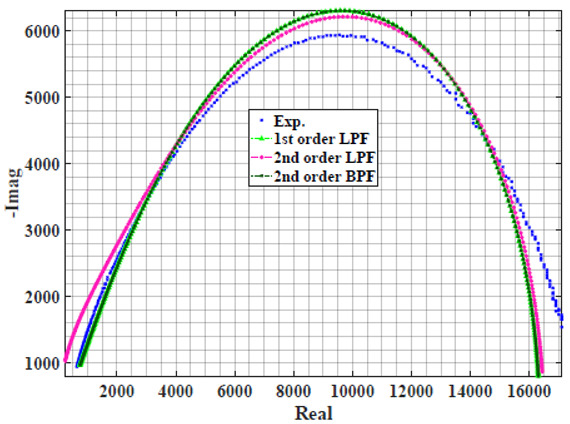
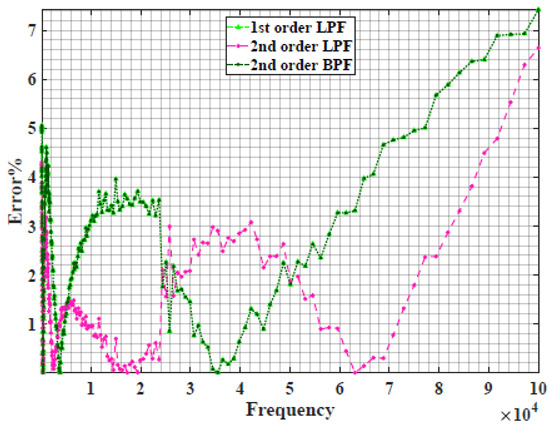
Using WCA optimisation, the Nyquist and error plot of the experimental and the fitted single filters.

Nyquist Error
Apple graphic file with name sensors-22-05659-i001.jpg graphic file with name sensors-22-05659-i002.jpg
Cucumber graphic file with name sensors-22-05659-i003.jpg graphic file with name sensors-22-05659-i004.jpg
Eggplant graphic file with name sensors-22-05659-i005.jpg graphic file with name sensors-22-05659-i006.jpg
Kiwi graphic file with name sensors-22-05659-i007.jpg graphic file with name sensors-22-05659-i008.jpg
Peach graphic file with name sensors-22-05659-i009.jpg graphic file with name sensors-22-05659-i010.jpg
Pear graphic file with name sensors-22-05659-i011.jpg graphic file with name sensors-22-05659-i012.jpg
Plum graphic file with name sensors-22-05659-i013.jpg graphic file with name sensors-22-05659-i014.jpg
Tomato graphic file with name sensors-22-05659-i015.jpg graphic file with name sensors-22-05659-i016.jpg