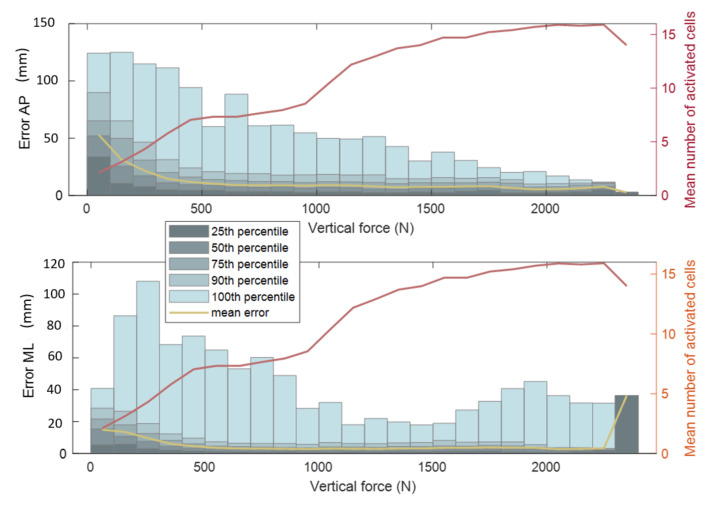
Figure 6.
AP and ML component of the absolute error of piCoP as a function of the vertical force measured by the pressure insoles. The vertical force were grouped to fit 100 N force intervals. The mean absolute error piCoP is represented for each vertical force interval (yellow). The mean number of activated pressure cell is represented for each force interval (red) on the right axis. The number of data points (N) for each box is indicated at the top of the graph window.

