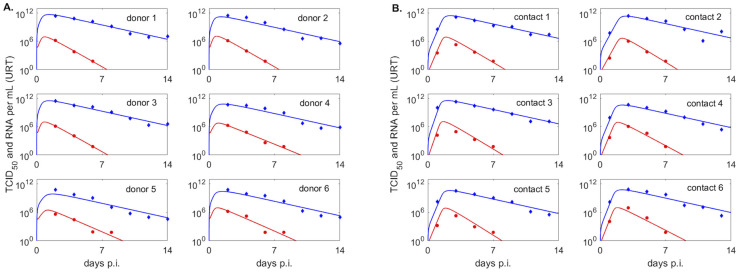
Fig 4. Infectious virus and viral RNA dynamics in upper respiratory tract of donor and contact groups.
Dynamics of infectious virus Vu (red lines) and viral RNA Ru (blue lines) as given by model Eq 3 versus infectious viral titers (red circles) and viral RNA (blue diamonds) in the upper respiratory tract of (A.) donors, (B.) contacts with fixed initial virus, V0 = 1. Model parameters are given in Table 2.

