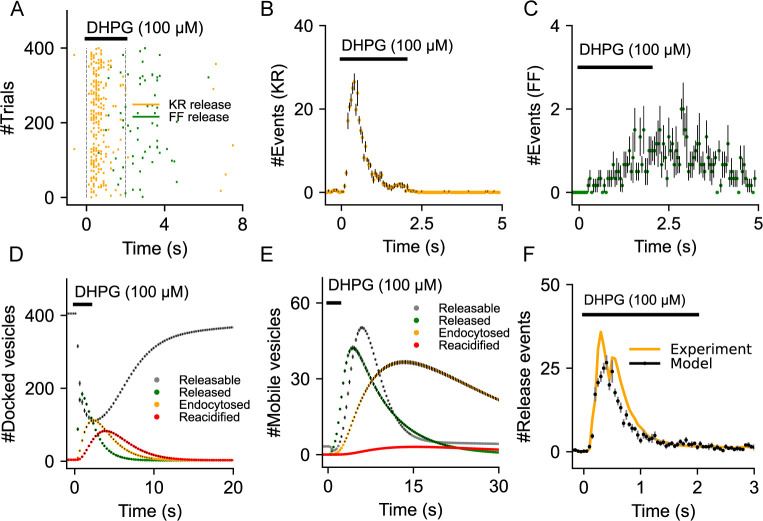
Fig 3. Validation of the gliotransmitter release model.
(A) Raster plot of kiss-and-run and full fusion releases from an astrocytic compartment stimulated with DHPG (100 μM, 2 sec). (B) Distribution of kiss-an-run release times shows the rapid rise in release events that decay exponentially within the stimulus duration. (C) Temporal distribution indicates the comparatively slow and low number of full-fusion events that extends beyond the stimulus duration. (D) Time courses indicate the dynamics of docked vesicle release, endocytosis and reacidification. (E) Time courses indicate the dynamics of mobile vesicle release, endocytosis and reacidification. (F) Temporal distribution of total release events is in good agreement with experimental data from Marchaland et al. (Marchaland et al., 2008a). Error bars indicate the standard error of the mean computed from 6 independent sets of simulation trials.

