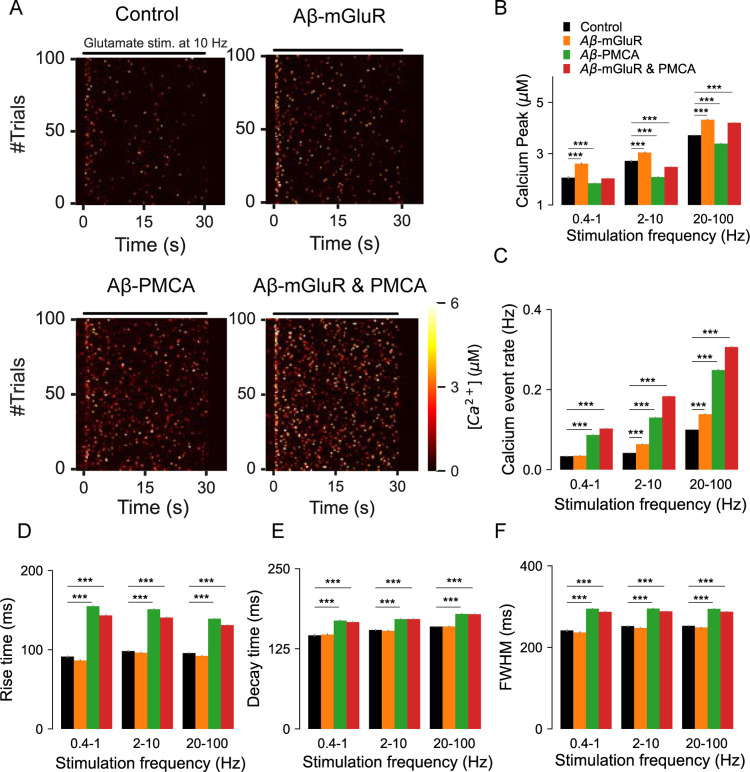
Fig 5. Quantification of the dynamics and kinetics of Ca2+ events from astrocytic compartments stimulated with glutamate vesicles.
(A) Representative heat maps highlight the differences in Ca2+ dynamics in the presence of Aβ conditions. (B) Peak Ca2+ amplitude averaged across different ranges of stimulation frequencies. (C) Glutamate-evoked Ca2+ events are more frequent in astrocytes with Aβ conditions when compared to control. (D) The presence of Aβ-PMCA condition increases the (E) rise time, (F) decay time and (F) Full width at half maximum of astrocytic Ca2+ events. Error bars indicate the standard error of the mean from 6 independent datasets.

