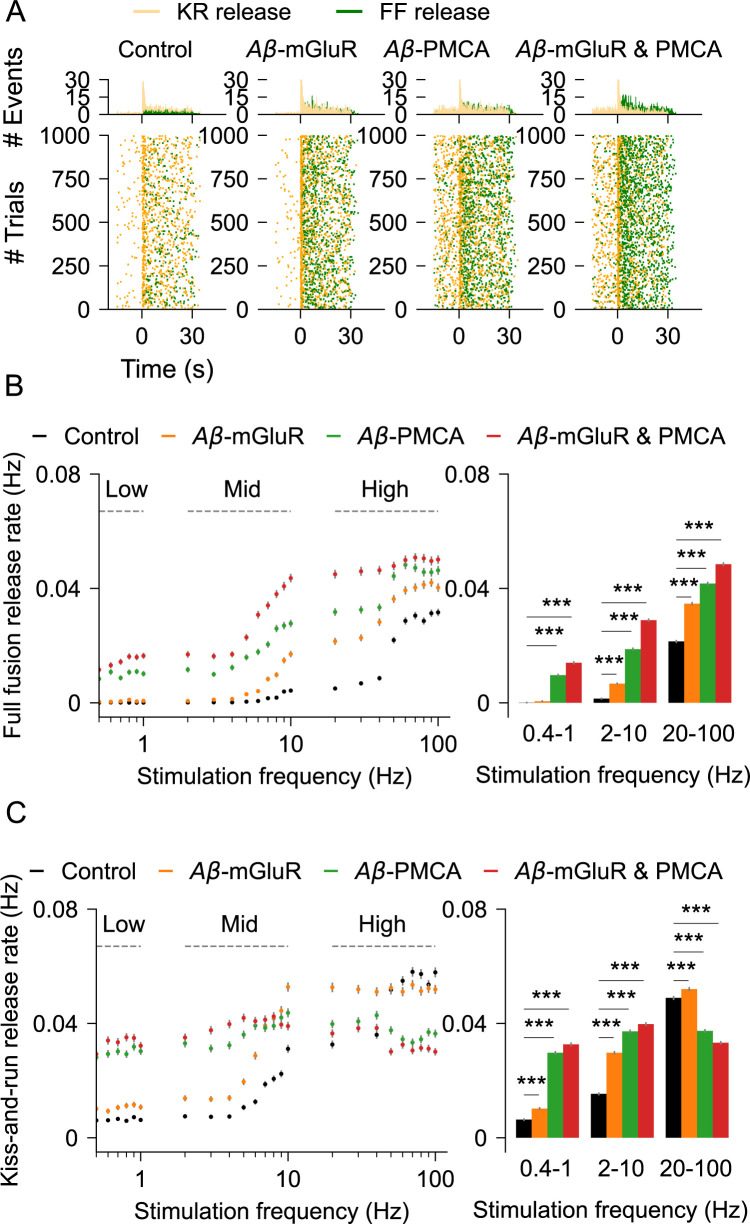
Fig 6. Quantification of gliotransmission in astrocytic compartments stimulated with glutamate.
(A) Raster plots of kiss-and-run and full-fusion releases in control astrocyte and in the presence of Aβ conditions. Top: temporal histograms. (B) Rate of full fusions for different glutamate stimulation rates. Right: release rates for the three stimulus groups (C) Rate of kiss-and-run exocytosis. Right: release rates pooled into three simulation groups. Error bars indicate the standard error of the mean computed from 6 independent datasets.

