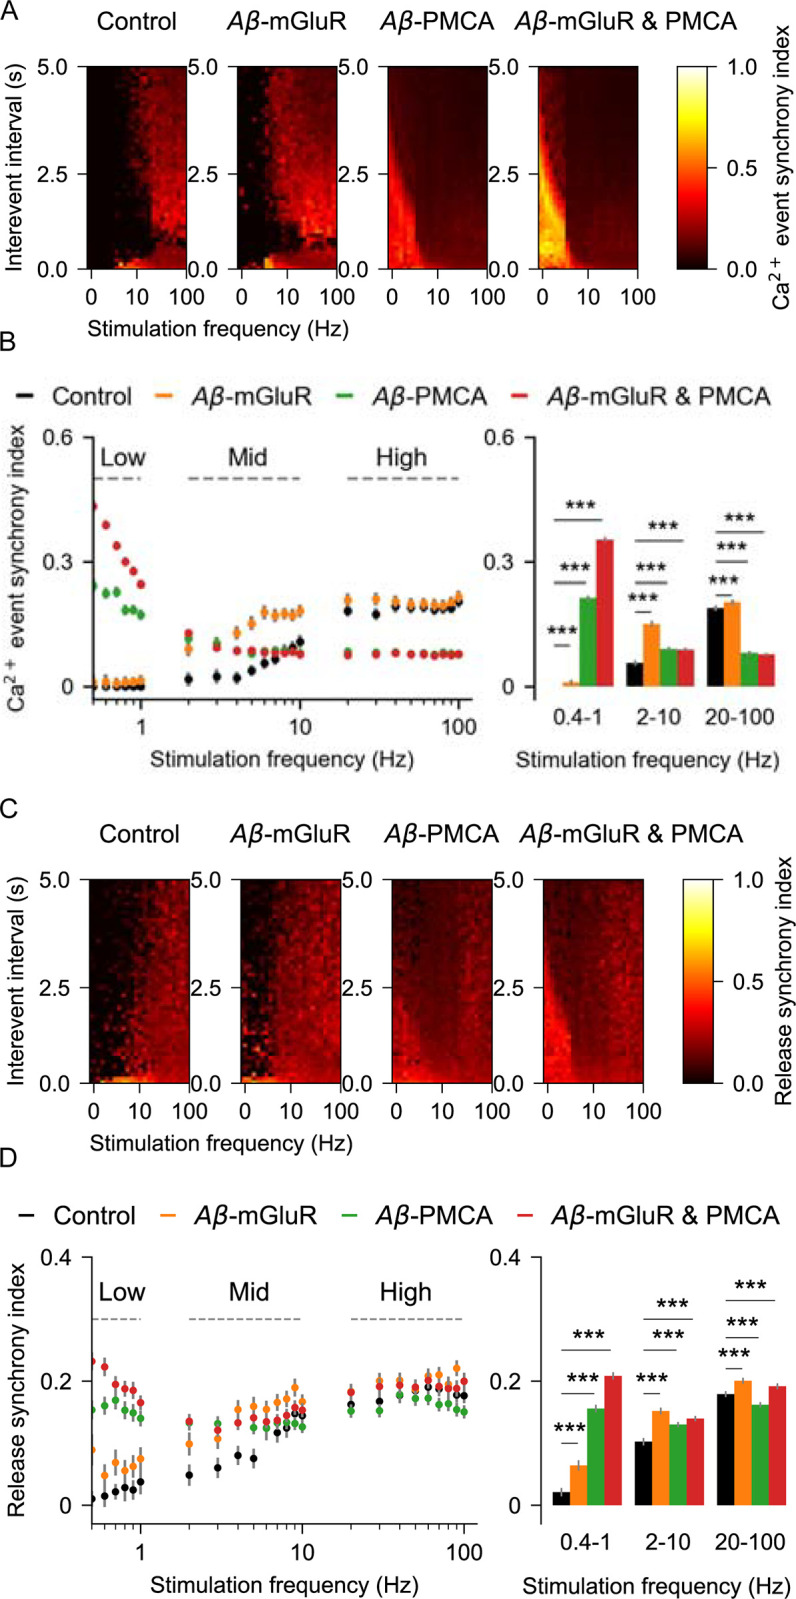
Fig 7. Synchrony of Ca2+ and gliotransmitter release events from astrocytic compartments stimulated with glutamate.

(A) Heat maps of Ca2+ event synchrony at different inter-event intervals and stimulation frequencies in the presence and absence of Aβ conditions. (B) Ca2+ synchrony averaged across event intervals at different glutamate stimulation rates is different between control and Aβ conditions. Right: at low stimulation regime, synchrony is high with the Aβ-PMCA condition, whereas at high stimulation rates, synchrony is more in the Aβ-mGluR condition (C) Heat maps of release event synchrony at different inter-event intervals and stimulation frequencies in the presence and absence of Aβ conditions. (D) synchrony of release averaged across event intervals at different glutamate stimulation rates is different between control and Aβ conditions. Right: bar graph indicates the increase in release synchrony at different stimulation regimes in all the Aβ conditions. Error bars indicate the standard error of the mean computed by bootstrapping 100 times with a sample size of 1000.
